VALARTH See the full analysis in the appOpen in app
Multi Asset Allocation · Hybrid

SBI Multi Asset Allocation Fund

SBI Funds Management Limited
Benchmark
45% BSE 500 TRI + 40% Crisil Composite Bond Fund Index + 10% Domestic Prices of Gold + 5% Domestic Prices of Silver.
Riskometer
Very High
Size
₹21,157 cr
Allotted
Not on record
Holdings as of
Not on record

SBI Multi Asset Allocation Fund is a multi asset allocation fund of SBI Funds Management Limited with ₹21,157 cr under management. It is ahead of its benchmark (45% BSE 500 TRI + 40% Crisil Composite Bond Fund Index + 10% Domestic Prices of Gold + 5% Domestic Prices of Silver.) in 1 of 1 periods. Its direct plan charges 0.66% a year.

Has SBI Multi Asset Allocation Fund beaten its benchmark?

Ahead of its benchmark, 45% BSE 500 TRI + 40% Crisil Composite Bond Fund Index + 10% Domestic Prices of Gold + 5% Domestic Prices of Silver., in 1 of 1 periods in AMFI's figures; +5.16% over the last year against +3.08%.

Period returns

Direct Plan, growth · 3y and longer a year
PeriodFundNifty 500 TRIAhead
1 month−2.06% −3.60% —
3 months−1.61% −5.03% —
6 months+0.97% −1.83% —
1 year+5.16% −4.06% +9.22 pts
3 years+14.17% +9.27% +4.90 pts
5 years+12.53% +8.00% +4.53 pts
10 years+11.81% +12.69% −0.88 pts
Since start
from 19 Mar 2013
+12.10%——
Valarth price history to 13 Oct 2026 · the index is the one the fund is nearest; — not on record

Official figures

AMFI performance feed, 13 Oct 2026
Ahead of its benchmark (45% BSE 500 TRI + 40% Crisil Composite Bond Fund Index + 10% Domestic Prices of Gold + 5% Domestic Prices of Silver.) in 1 of 1 periods.
PeriodDirectRegularBenchmarkAheadRank
1y +5.16%+4.36%+3.08% +2.08 🔒
3y +14.14%+13.17%— — 🔒
5y +12.52%+11.54%— — 🔒
10y +11.80%+10.82%— — 🔒
Ahead in points a year · its rank among Multi Asset Allocation funds, and how steady the lead is, in the app

Value of 100, month-end

Oct 2016 to 13 Oct 2026
50100150200250300350400 20172019202120232025
Fund 304Nifty 500 TRI 327

₹100 put in at the start of Oct 2016 would be ₹304 on 13 Oct 2026, against ₹327 in the Nifty 500 TRI.

Risk, falls and every year

🔒 Pro
Its worst fall and how long it took to recover, three-year stretches, Sharpe, beta and capture ratios, calendar years beside the index, and money in and out: in the app.

What does SBI Multi Asset Allocation Fund cost?

0.66% a year on the direct plan, 1.39% on the regular plan; 5 of 19 funds in its category charge less.

Direct plan
0.66% a year
Category median 0.79%
Regular plan
1.39% a year
Category median 2.10%
Gap
0.73 points
for the same holdings
5 of 19 funds in its category charge less on the direct plan.
Expense report, Oct 2026 · Hybrid Scheme - Multi Asset Allocation

What the regular plan costs you over time

🔒 Pro
The same money left for years in the direct and the regular plan, side by side, and what the commission takes: in the app.

Who manages SBI Multi Asset Allocation Fund?

ManagersNot on record
Benchmark as filedNot on record
Exit load
Not on record

What does SBI Multi Asset Allocation Fund hold?

131 holdings as of None; the ten largest are 25.1% of the fund, the largest Brookfield India Real Estate Trust at 2.4%.

Mix

Holdings as of None
Equity50.3%Debt32.2%Cash7.5%Other10.0%
Holdings
131
75 shares
Top ten
25.1%
of the fund
Effective holdings
44.8
spread, as if equal-weighted
Matched to our table
100%
of the equity

Five largest industries

% of fund
Banks18.7%
Realty14.5%
Pharmaceuticals & Biotechnology6.50%
Auto Components5.40%
Transport Services4.70%

By company size

% of equity · SEBI size lists
Large Cap38.5%Mid Cap23.9%Small Cap37.6%

How does SBI Multi Asset Allocation Fund score against its category?

Seven scores against funds of its kind, and the warning signs it trips.

Scorecard

🔒 Pro
Seven scores, each out of 5, against funds in its category, with the reasons, and the warning signs it trips: in the app.

Are the companies inside any good?

The holdings by valuation, forensic risk, business quality and balance sheet, weighted by their share of the fund.

The companies inside

🔒 Pro
The holdings weighted by their share of the fund: P/E and ROE, forensic risk levels, Valarth's valuation view, quality, moats, balance sheets and who owns them: in the app.

How is SBI Multi Asset Allocation Fund run?

Turnover, what it bought and sold, its cash and its record in new listings, from its monthly holdings files.

How it is run

🔒 Pro
Turnover, what it bought and sold and when, how long it holds, size drift, cash and its record in new listings, from up to two years of monthly holdings files: in the app.

Which funds hold much the same?

The index it is nearest and the funds whose holdings overlap most.

not an index tracker
Nearest to the Nifty 500: 78% of it differs from the index (an active fund is usually above 60%).
Active share 77.7%60%

Funds that hold much the same

% of holdings in common
SBI Balanced Advantage Fund46.1% the same
36 shared holdings
SBI Contra Fund43.5% the same
35 shared holdings
DSP Equity Savings Fund34.2% the same
30 shared holdings

How much is in its sponsor's own group?

Holdings in companies of the fund house's sponsor group, beside the index.

Related-party exposure

🔒 Pro
How much of the fund is in companies of its sponsor's own group, beside what the index holds of them: in the app.

Questions people ask

What is the expense ratio of SBI Multi Asset Allocation Fund?

0.66% a year on the direct plan and 1.39% on the regular plan (expense report, Oct 2026).

How has SBI Multi Asset Allocation Fund done?

Its direct plan returned +14.14% a year over 3 years against None for its benchmark, 45% BSE 500 TRI + 40% Crisil Composite Bond Fund Index + 10% Domestic Prices of Gold + 5% Domestic Prices of Silver., as of 13 Oct 2026.

Inside the app

See SBI Multi Asset Allocation Fund beside your own funds in Valarth
Start freeStart free
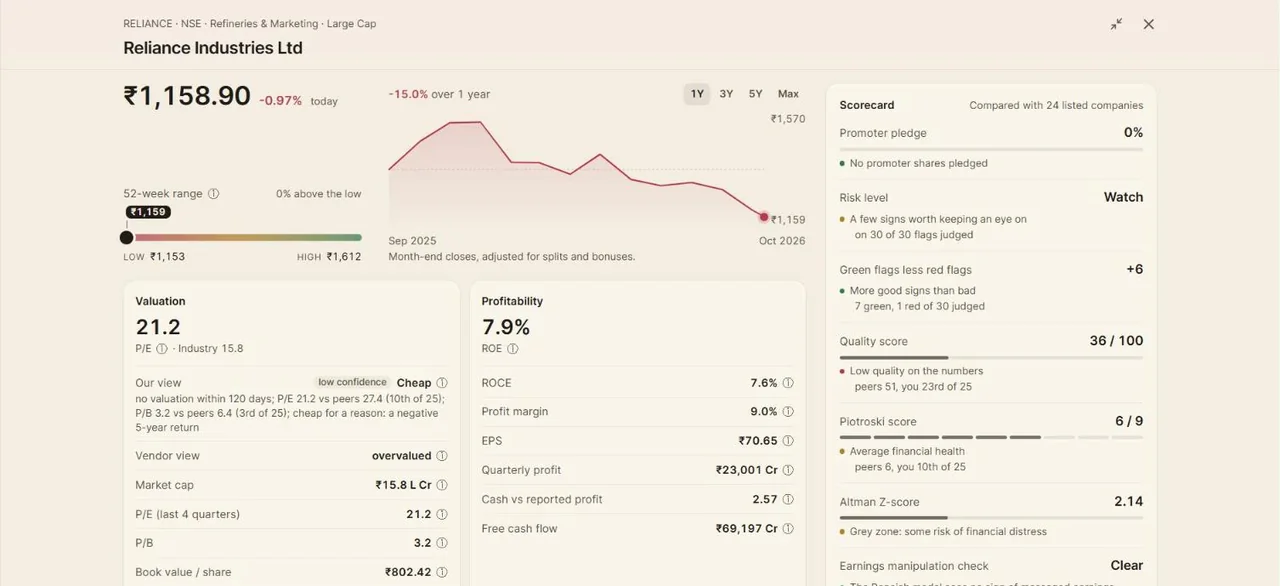
A Valarth stock page: the share price with its chart and 52-week range, valuation and profitability figures, and a scorecard of health checks.
Stock pagePrice, valuation, profitability and a scorecard of health checks for every company, each figure explained.
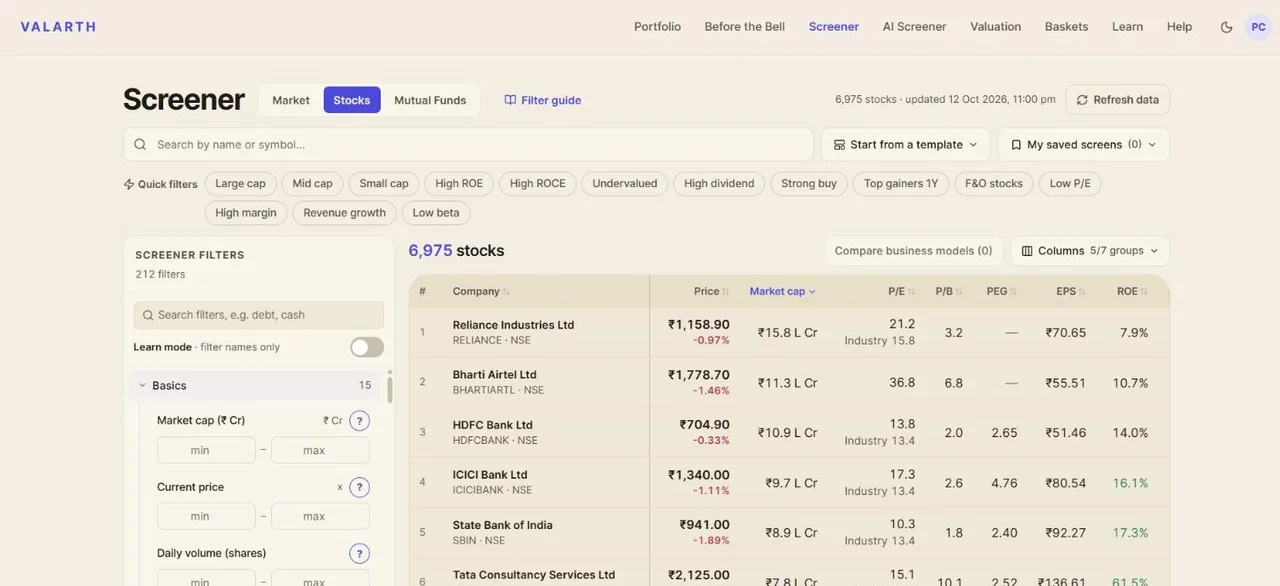
The Valarth stock screener: a table of companies with price, market cap, P/E, P/B, PEG, EPS and ROE, and filters down the left.
ScreenerEvery listed company, filtered on 212 figures, each with a plain-language lesson beside it.
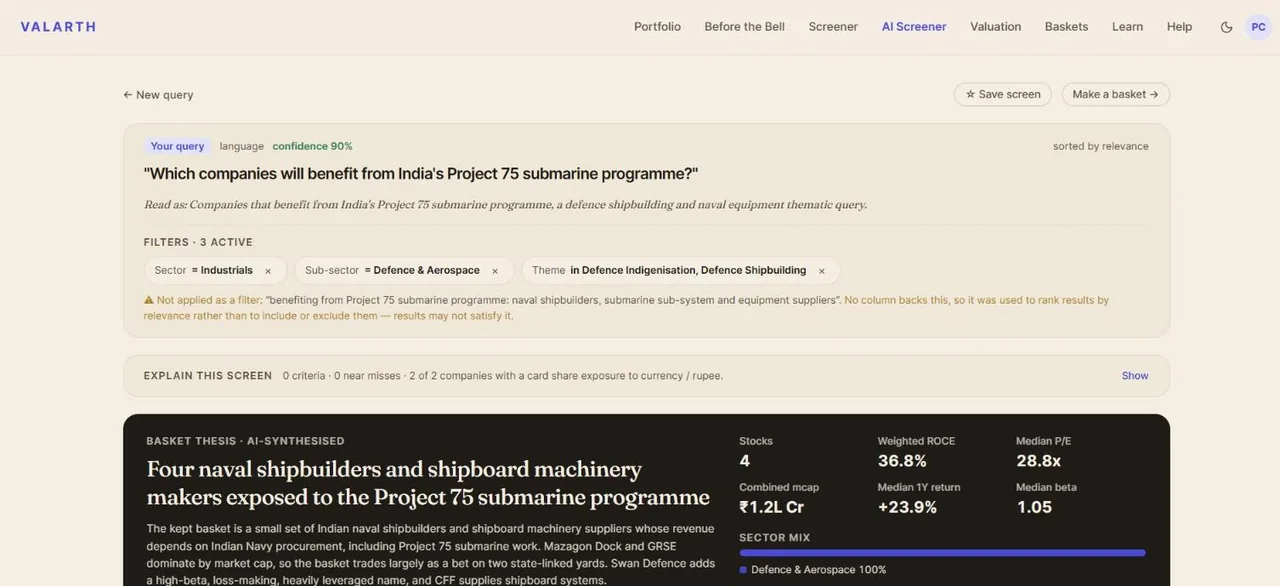
The Valarth AI Screener answering 'Which companies will benefit from India's Project 75 submarine programme?' with a basket of four naval shipbuilders and a written thesis.
AI ScreenerAsk a question in plain English, like which companies benefit from India's Project 75. It reads the intent, builds the screen and writes the thesis.
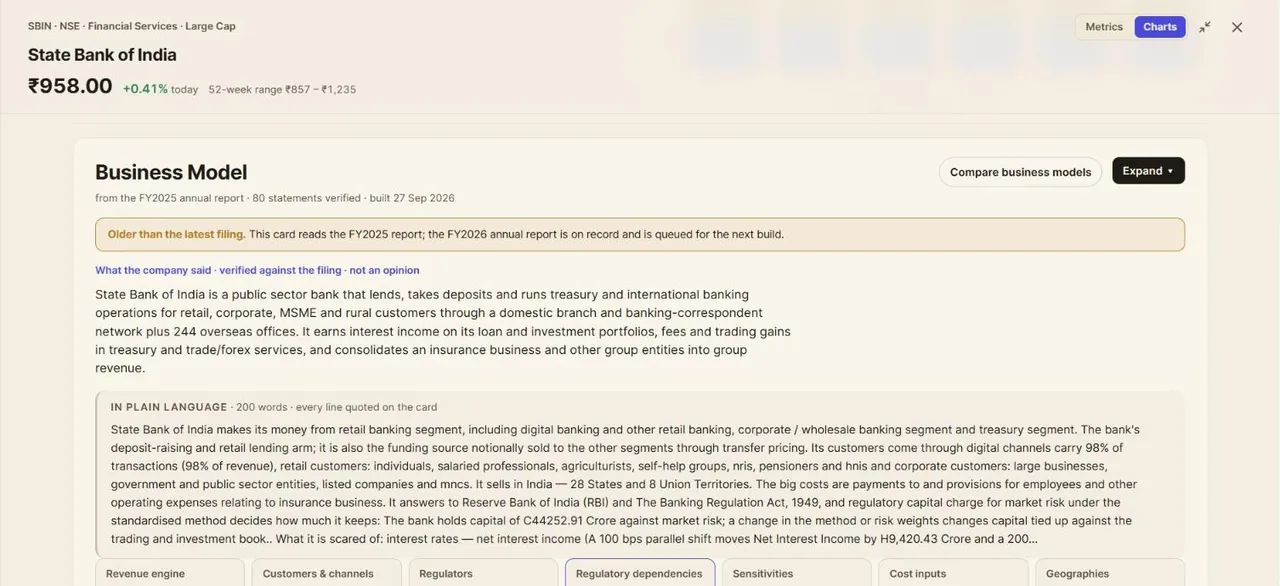
A Valarth business-model card for State Bank of India, with a plain-language summary and statements verified against the filing.
Business modelHow a company makes money and what can hurt it, each statement checked against its annual report.
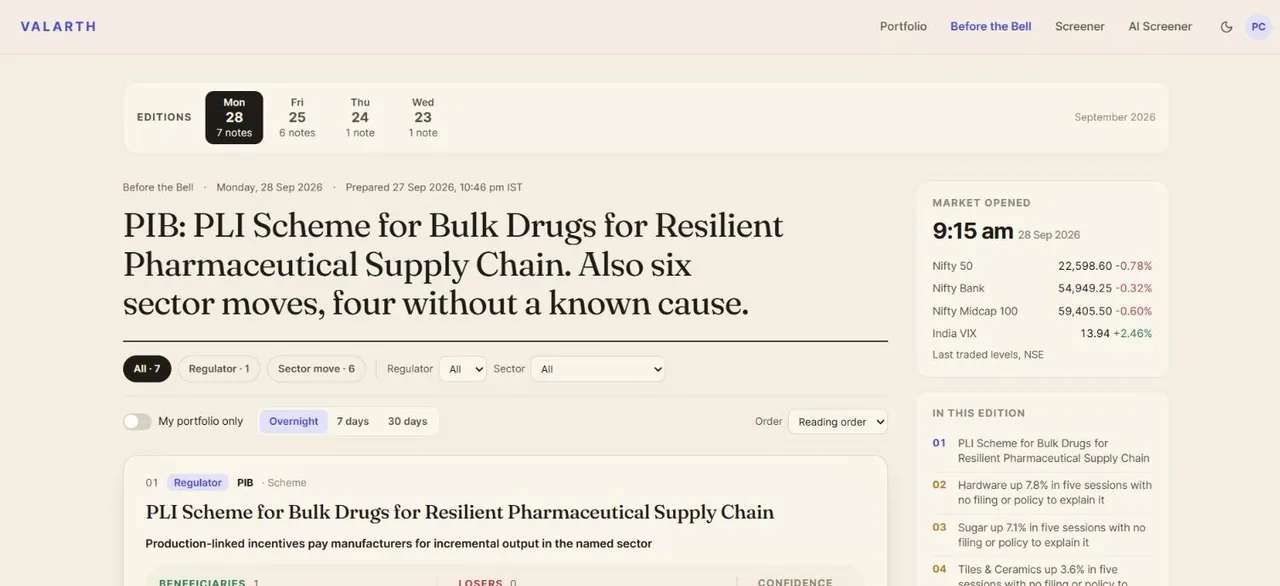
Valarth's Before the Bell edition, with the day's headline, regulator notes and sector moves.
Before the BellA morning edition before the market opens: what moved, which rule changed, and what it means for your holdings.

SBI Multi Asset Allocation Fund in the app: beside your own funds, with what you own through them

Share this page