VALARTH Open the screenerOpen in app
Who builds India

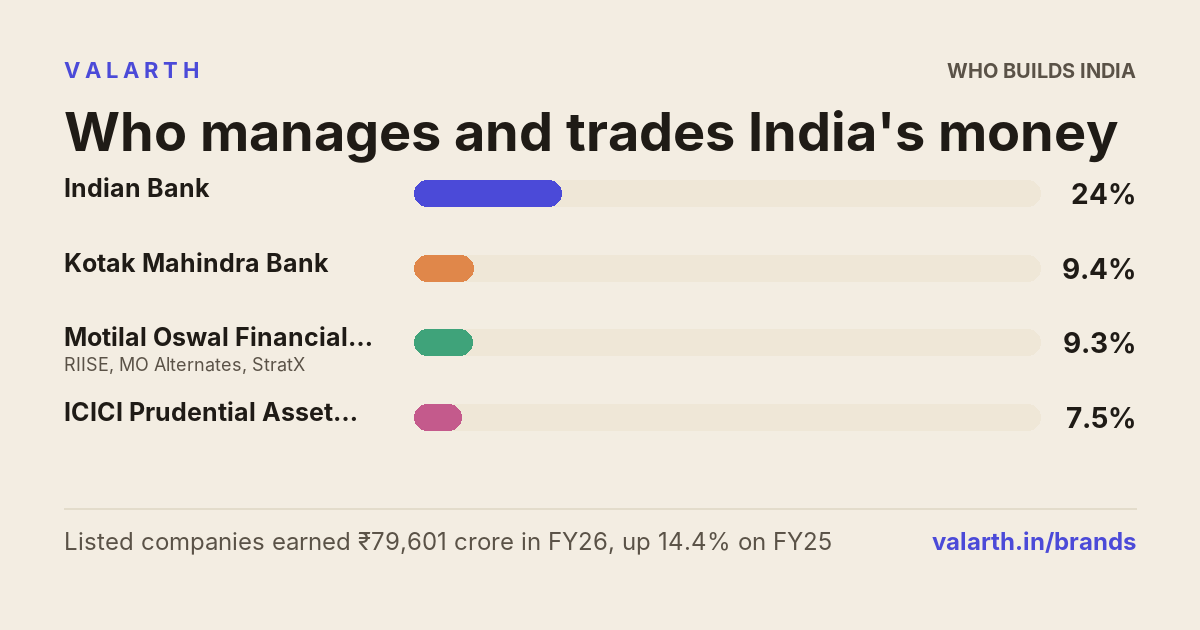
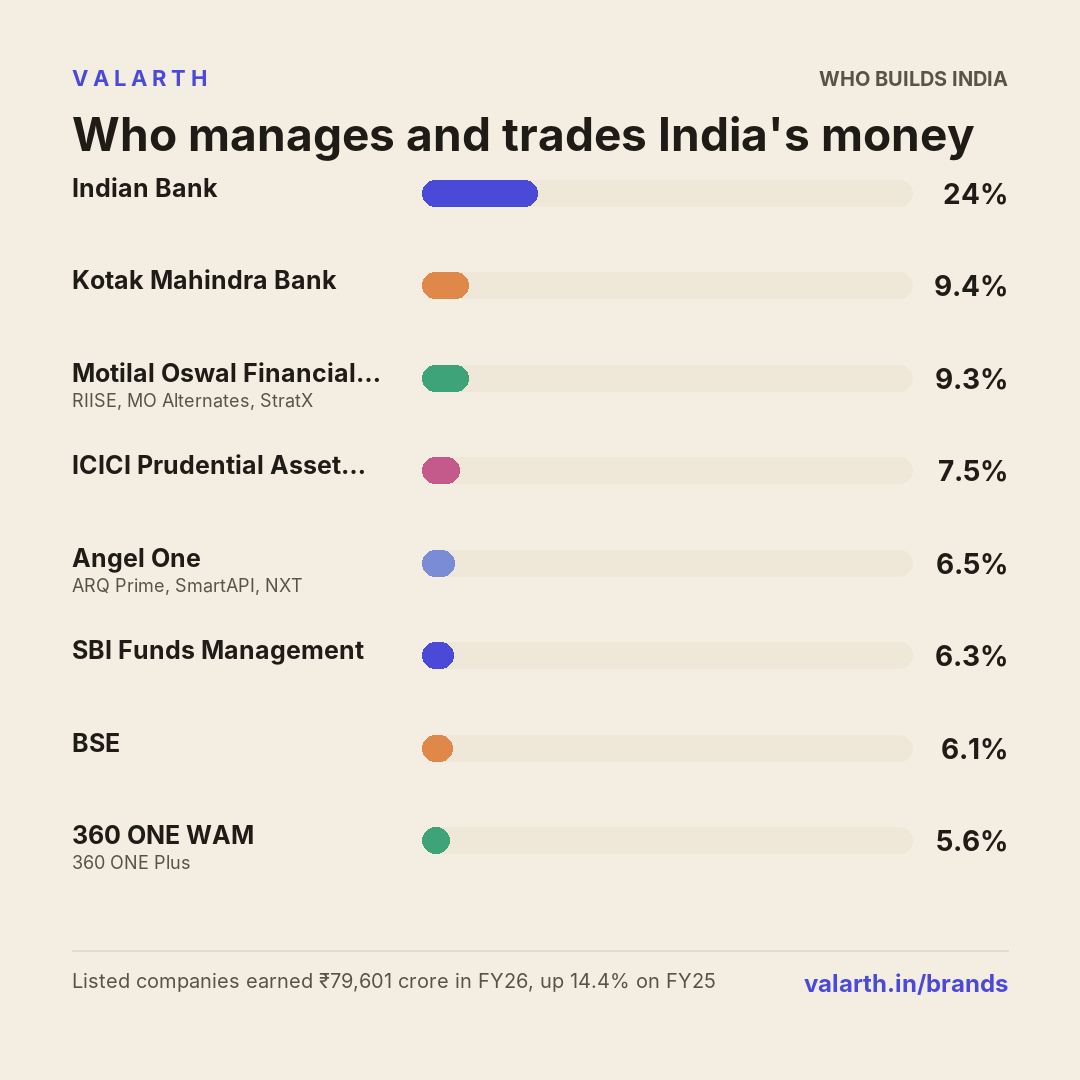
Who manages and trades India's money

The listed companies behind it: RIISE, MO Alternates, StratX, ARQ Prime, SmartAPI, NXT.

17 listed companies earned ₹79,601 crore from asset management, broking and exchanges in FY26, up 14.4% on FY25. Indian Bank earned the most, 23.5% of it. HDFC Asset Management Company Ltd earned the most on each rupee of sales: 90.3%.

Share
Listed companies' sales, FY26
₹79,601 Cr
up 14.4% on FY25
Largest seller
23.5%
Indian Bank
Best margin
90.3%
HDFC Asset Management Company Ltd
Fastest growing, 3 years
+68.9%
BSE Ltd

The brands, and who owns them

24 brands of asset management, broking and exchanges, best known first
Motilal Oswal Financial Services LtdNSE: MOTILALOFS · 9.3% of the listed sales
RIISEMO AlternatesStratX
Angel One LtdNSE: ANGELONE · 6.5% of the listed sales
ARQ PrimeSmartAPINXT
360 ONE WAM LtdNSE: 360ONE · 5.6% of the listed sales
360 ONE Plus
Nuvama Wealth Management LtdNSE: NUVAMA · 5.2% of the listed sales
Nuvama Asset ManagementNuvama Market AppNuvama PrivateNuvama WealthCosmosNuvama Asset ServicesNuvama One
HDFC Asset Management Company LtdNSE: HDFCAMC · 5.2% of the listed sales
HDFC Mutual FundHDFC Flexi Cap FundHDFC AMC AIFHDFC AMC AIF-IIHDFC AMC Portfolio Managers
Multi Commodity Exchange of India LtdNSE: MCX · 2.9% of the listed sales
iCOMDEX
Aditya Birla Sun Life AMC LtdNSE: ABSLAMC · 2.3% of the listed sales
ABSL Money Manager FundABSL Flexi Cap Fund (IFSC)ABSL Global Bluechip Fund (IFSC)ABSL Structured Opportunities Fund II

RIISE, MO Alternates, StratX are Motilal Oswal Financial Services Ltd's; ARQ Prime, SmartAPI, NXT are Angel One Ltd's; 360 ONE Plus is 360 ONE WAM Ltd's; Nuvama Asset Management, Nuvama Market App, Nuvama Private, Nuvama Wealth and others are Nuvama Wealth Management Ltd's; HDFC Mutual Fund, HDFC Flexi Cap Fund, HDFC AMC AIF, HDFC AMC AIF-II and others are HDFC Asset Management Company Ltd's; iCOMDEX is Multi Commodity Exchange of India Ltd's; ABSL Money Manager Fund, ABSL Flexi Cap Fund (IFSC), ABSL Global Bluechip Fund (IFSC), ABSL Structured Opportunities Fund II are Aditya Birla Sun Life AMC Ltd's. Brands are read from each company's filings and checked against a public source.

Who sells the most

Share of the listed companies' sales, FY26
Indian Bank₹18,740 Cr · 24% of its sales
23.5%
Kotak Mahindra Bank Ltd₹7,500 Cr · 7% of its sales Broking 58% · Asset management 42%
9.4%
Motilal Oswal Financial Services Ltd₹7,410 Cr · 79% of its sales Wealth management 50% · Asset management 41% · Broking 10%
9.3%
ICICI Prudential Asset Management Co Ltd₹6,001 Cr · 100% of its sales
7.5%
Angel One Ltd₹5,137 Cr · 100% of its sales
6.5%
SBI Funds Management Ltd₹4,990 Cr · 100% of its sales
6.3%
BSE Ltd₹4,834 Cr · 100% of its sales
6.1%
360 ONE WAM Ltd₹4,475 Cr · 103% of its sales Wealth management 77% · Asset management 23%
5.6%
Nuvama Wealth Management Ltd₹4,175 Cr · 90% of its sales Wealth management 57% · Broking 40% · Asset management 3%
5.2%
HDFC Asset Management Company Ltd₹4,122 Cr · 100% of its sales
5.2%
Nippon Life India Asset Management Ltd₹2,709 Cr · 100% of its sales
3.4%
Aditya Birla Capital Ltd₹2,503 Cr · 5% of its sales Asset management 81% · Broking 19%
3.1%
Multi Commodity Exchange of India Ltd₹2,302 Cr · 100% of its sales
2.9%
Aditya Birla Sun Life AMC Ltd₹1,845 Cr · 100% of its sales
2.3%
Authum Investment & Infrastructure Ltd₹1,276 Cr · 49% of its sales
1.6%
Anand Rathi Wealth Ltd₹1,149 Cr · 100% of its sales
1.4%
Tata Capital Ltd₹435 Cr · 1% of its sales
0.5%

Indian Bank had 23.5% of the listed companies' revenue from asset management, broking and exchanges here, 2.5 times as much as Kotak Mahindra Bank Ltd, the next largest. The two together sold 33%; the other 15 the rest.

From each company's own sales figures for this kind of product (its reported segment, or its whole sales where that is all it sells). Private makers are not counted, so this is the split among listed companies, not the whole market.

What it is made of

Sales by product line, FY26
Asset management₹28,986 Cr
36.4%
Broking₹12,355 Cr
15.5%
Wealth management₹10,675 Cr
13.4%
Exchanges and depositories₹7,136 Cr
9.0%
Not reported by product₹20,450 Cr
25.7%

Of the sales reported by product line, asset management is the largest at ₹28,986 Cr, then broking at ₹12,355 Cr.

Where a company reports its product lines separately. "Not reported by product" is sales a company reports only as a whole.

How the sales have grown, and who sold them

Revenue from asset management, broking and exchanges each financial year in ₹ crore (L = lakh crore), the change on the year before above each column
ICICI Prudential Asset Management Co Ltd, FY19: ₹2,004 CrAngel One Ltd, FY19: ₹789 Cr11 others, FY19: ₹4,363 Cr ₹7,157 Cr FY19 ICICI Prudential Asset Management Co Ltd, FY20: ₹2,007 CrAngel One Ltd, FY20: ₹755 CrSBI Funds Management Ltd, FY20: ₹1,319 Cr11 others, FY20: ₹3,827 Cr ₹7,908 Cr+10% FY20 ICICI Prudential Asset Management Co Ltd, FY21: ₹2,234 CrAngel One Ltd, FY21: ₹1,299 CrSBI Funds Management Ltd, FY21: ₹1,621 Cr11 others, FY21: ₹3,993 Cr ₹9,146 Cr+16% FY21 ICICI Prudential Asset Management Co Ltd, FY22: ₹2,635 CrAngel One Ltd, FY22: ₹2,297 CrSBI Funds Management Ltd, FY22: ₹2,011 Cr11 others, FY22: ₹4,664 Cr ₹11,607 Cr+27% FY22 ICICI Prudential Asset Management Co Ltd, FY23: ₹2,838 CrAngel One Ltd, FY23: ₹3,021 CrSBI Funds Management Ltd, FY23: ₹2,423 Cr11 others, FY23: ₹7,429 Cr7,429 ₹15,711 Cr+35% FY23 ICICI Prudential Asset Management Co Ltd, FY24: ₹3,761 CrAngel One Ltd, FY24: ₹4,280 CrSBI Funds Management Ltd, FY24: ₹3,439 Cr11 others, FY24: ₹10,354 Cr10,354 ₹21,834 Cr+39% FY24 Indian Bank, FY25: ₹17,177 Cr17,177Kotak Mahindra Bank Ltd, FY25: ₹6,684 Cr6,684Motilal Oswal Financial Services Ltd, FY25: ₹7,470 Cr7,470ICICI Prudential Asset Management Co Ltd, FY25: ₹4,980 CrAngel One Ltd, FY25: ₹5,238 CrSBI Funds Management Ltd, FY25: ₹4,251 Cr11 others, FY25: ₹22,266 Cr22,266 ₹68,066 Cr+212% FY25 Indian Bank, FY26: ₹18,740 Cr18,740Kotak Mahindra Bank Ltd, FY26: ₹7,500 Cr7,500Motilal Oswal Financial Services Ltd, FY26: ₹7,410 Cr7,410ICICI Prudential Asset Management Co Ltd, FY26: ₹6,001 Cr6,001Angel One Ltd, FY26: ₹5,137 CrSBI Funds Management Ltd, FY26: ₹4,990 Cr11 others, FY26: ₹29,824 Cr29,824 ₹79,601 Cr+17% FY26
Indian BankKotak Mahindra Bank LtdMotilal Oswal Financial Services LtdICICI Prudential Asset Management Co LtdAngel One LtdSBI Funds Management Ltd11 others

The listed companies here earned ₹79,601 Cr from asset management, broking and exchanges in FY26. Counting only the companies with figures in both years, sales went from ₹7,157 Cr in FY19 to ₹23,976 Cr, 3.4 times as much. The biggest rise was in FY24 (+39%) and the weakest year FY20 (-8%). Indian Bank's part of the total went from 25% in FY25 to 24% in FY26. Over three years BSE Ltd grew fastest, +68.9% a year. Some companies are counted only from a later year (Indian Bank from FY25; Kotak Mahindra Bank Ltd from FY25; Motilal Oswal Financial Services Ltd from FY25; SBI Funds Management Ltd from FY20; 360 ONE WAM Ltd from FY25; Nuvama Wealth Management Ltd from FY25; HDFC Asset Management Company Ltd from FY23; Aditya Birla Capital Ltd from FY25; Authum Investment & Infrastructure Ltd from FY26; Tata Capital Ltd from FY26).

Counted from the first year their figures for this are available: Indian Bank from FY25; Kotak Mahindra Bank Ltd from FY25; Motilal Oswal Financial Services Ltd from FY25; SBI Funds Management Ltd from FY20; 360 ONE WAM Ltd from FY25; Nuvama Wealth Management Ltd from FY25; HDFC Asset Management Company Ltd from FY23; Aditya Birla Capital Ltd from FY25; Authum Investment & Infrastructure Ltd from FY26; Tata Capital Ltd from FY26. A jump in that year is partly that.

Who earns the most on each rupee

Operating profit as a share of revenue from asset management, broking and exchanges, each financial year
0%40%81%FY19FY20FY21FY22FY23FY24FY25FY26 Indian Bank: 35.7%Indian Bank: 33.9%33.9% Kotak Mahindra Bank Ltd: 48.6%Kotak Mahindra Bank Ltd: 47.6%47.6% Motilal Oswal Financial Services Ltd: 33.1%Motilal Oswal Financial Services Ltd: 39.7%39.7% ICICI Prudential Asset Management Co Ltd: 52.3%ICICI Prudential Asset Management Co Ltd: 70.3%ICICI Prudential Asset Management Co Ltd: 74.2%ICICI Prudential Asset Management Co Ltd: 73.2%ICICI Prudential Asset Management Co Ltd: 70.7%ICICI Prudential Asset Management Co Ltd: 71.7%ICICI Prudential Asset Management Co Ltd: 70.9%ICICI Prudential Asset Management Co Ltd: 73.4%73.4% Angel One Ltd: 15.8%Angel One Ltd: 15.1%Angel One Ltd: 31.6%Angel One Ltd: 36.4%Angel One Ltd: 39.4%Angel One Ltd: 35.4%Angel One Ltd: 36.0%Angel One Ltd: 33.3%33.3% SBI Funds Management Ltd: 60.2%SBI Funds Management Ltd: 70.3%SBI Funds Management Ltd: 71.6%SBI Funds Management Ltd: 73.5%SBI Funds Management Ltd: 78.1%SBI Funds Management Ltd: 79.5%SBI Funds Management Ltd: 80.6%80.6%
Indian BankKotak Mahindra Bank LtdMotilal Oswal Financial Services LtdICICI Prudential Asset Management Co LtdAngel One LtdSBI Funds Management Ltd

Operating profit before interest and tax, as a share of revenue from asset management, broking and exchanges. Indian Bank earned 33.9% on its sales in FY26, against 35.7% in FY25. Kotak Mahindra Bank Ltd earned 47.6% on its sales in FY26, against 48.6% in FY25. Motilal Oswal Financial Services Ltd earned 39.7% on its sales in FY26, against 33.1% in FY25. ICICI Prudential Asset Management Co Ltd earned 73.4% on its sales in FY26, against 54.4% in FY17; its best year was FY21 at 74.2%. Angel One Ltd earned 33.3% on its sales in FY26, against 8.7% in FY17; its best year was FY23 at 39.4%. SBI Funds Management Ltd earned 80.6% on its sales in FY26, against 60.2% in FY20.

The companies, and their brands

Company and brandsSales FY26Growth 1 yr3 yrs5 yrsMarginProfit shareReturn on assetsP/EROEShare price 1 yr
Indian Bank ₹18,740 Cr +9.1% — — 33.9% 15.6% 2.2% 8.9 18.2% +9.6%
Kotak Mahindra Bank Ltd
Sells in 30 states and 2 countries; exports 0.0% of turnover
₹7,500 Cr +12.2% — — 47.6% 8.7% 8.7% 21.5 11.1% +2.0%
Motilal Oswal Financial Services Ltd
RIISE, MO Alternates, StratX
Sells in 22 states and 6 countries; exports 0.23% of turnover
₹7,410 Cr -0.8% — — 39.7% 7.2% 9.7% 32.5 12.2% +7.0%
ICICI Prudential Asset Management Co Ltd
Sells in 27 states; exports 1.8% of turnover
₹6,001 Cr +20.5% +28.3% +21.9% 73.4% 10.8% — 41.0 85.8% —
Angel One Ltd
ARQ Prime, SmartAPI, NXT
Sells in 16 states and 1 countries; exports 0.02% of turnover
₹5,137 Cr -1.9% +19.3% +31.7% 33.3% 4.2% — 27.3 17.3% +28.9%
SBI Funds Management Ltd ₹4,990 Cr +17.4% +27.2% +25.2% 80.6% 9.8% — — 43.0% —
BSE Ltd
Sells in 28 states; exports 1.0% of turnover
₹4,834 Cr +63.5% +68.9% +47.3% 66.9% 7.9% — 49.1 49.1% +37.9%
360 ONE WAM Ltd
360 ONE Plus
Sells in 16 states and 4 countries; exports 3.26% of turnover
₹4,475 Cr +21.5% — — 35.2% 3.9% 5.9% 34.6 6.1% -4.4%
Nuvama Wealth Management Ltd
Nuvama Asset Management, Nuvama Market App, Nuvama Private, Nuvama Wealth, Cosmos, Nuvama Asset Services, Nuvama One
Sells in 22 states and 6 countries; exports 2.11% of turnover
₹4,175 Cr +11.6% — — 32.9% 3.4% 3.9% 30.3 33.0% +26.5%
HDFC Asset Management Company Ltd
HDFC Mutual Fund, HDFC Flexi Cap Fund, HDFC AMC AIF, HDFC AMC AIF-II, HDFC AMC Portfolio Managers
Sells in 36 states and 1 countries; exports 0.04% of turnover
₹4,122 Cr +17.8% +18.4% — 90.3% 9.1% — 33.9 32.9% -16.7%
Nippon Life India Asset Management Ltd ₹2,709 Cr +21.4% +21.3% +13.8% 73.1% 4.8% — 41.5 35.5% +21.1%
Aditya Birla Capital Ltd
Sells in 28 states; exports 0.0% of turnover
₹2,503 Cr +3.5% — — 53.7% 3.3% 16.8% 25.3 11.5% +29.1%
Multi Commodity Exchange of India Ltd
iCOMDEX
₹2,302 Cr +107.0% +64.9% +42.6% 73.4% 4.1% — 54.7 43.4% +76.0%
Aditya Birla Sun Life AMC Ltd
ABSL Money Manager Fund, ABSL Flexi Cap Fund (IFSC), ABSL Global Bluechip Fund (IFSC), ABSL Structured Opportunities Fund II
Sells in 29 states and 3 countries; exports 0.0% of turnover
₹1,845 Cr +9.5% +10.9% +8.9% 68.9% 3.1% — 28.3 25.5% +16.3%
Authum Investment & Infrastructure Ltd
Sells in 14 states; exports 0.0% of turnover
₹1,276 Cr — — — 77.2% 2.4% 7.0% 22.0 13.2% -13.2%
Anand Rathi Wealth Ltd
Sells in 12 states and 1 countries; exports 0.0% of turnover
₹1,149 Cr +22.4% +27.1% +32.7% 48.0% 1.4% — 76.5 45.3% +32.8%
Tata Capital Ltd ₹435 Cr — — — 20.2% 0.2% 2.9% 25.4 9.6% +2.5%
Brands are read from each company's filings and checked against a public source. Growth is the yearly rate of its revenue from asset management, broking and exchanges. Margin is the operating profit (before interest and tax) the company reports on them, as a share of those sales; profit share is its part of all the listed companies' profit on them; return on assets is that profit against the assets it reports for them. A company with no other business is measured on its whole accounts. Where a company's segments include sales between its own businesses (a bank's treasury lending to its retail arm), each segment is scaled down in proportion so that together they match what the company earns outside itself; companies report those internal sales only as a total. Not a recommendation to buy or sell.

Also sold by

These companies report this together with other businesses, so their figures are not counted above
Inside the app

See every one of these companies in Valarth
Start freeStart free
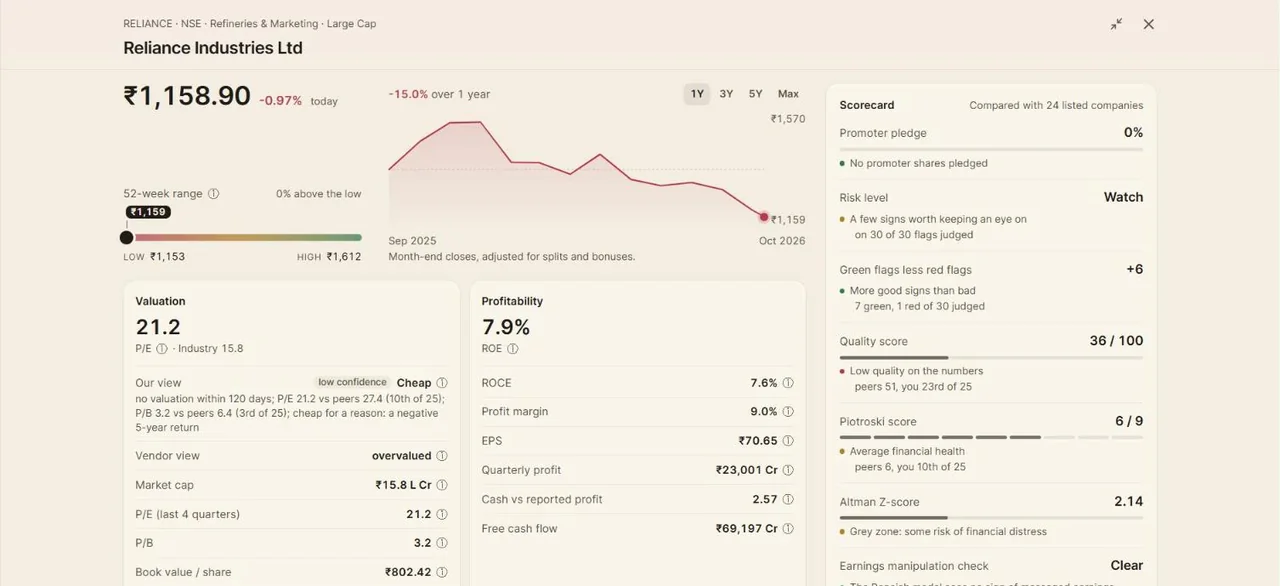
A Valarth stock page: the share price with its chart and 52-week range, valuation and profitability figures, and a scorecard of health checks.
Stock pagePrice, valuation, profitability and a scorecard of health checks for every company, each figure explained.
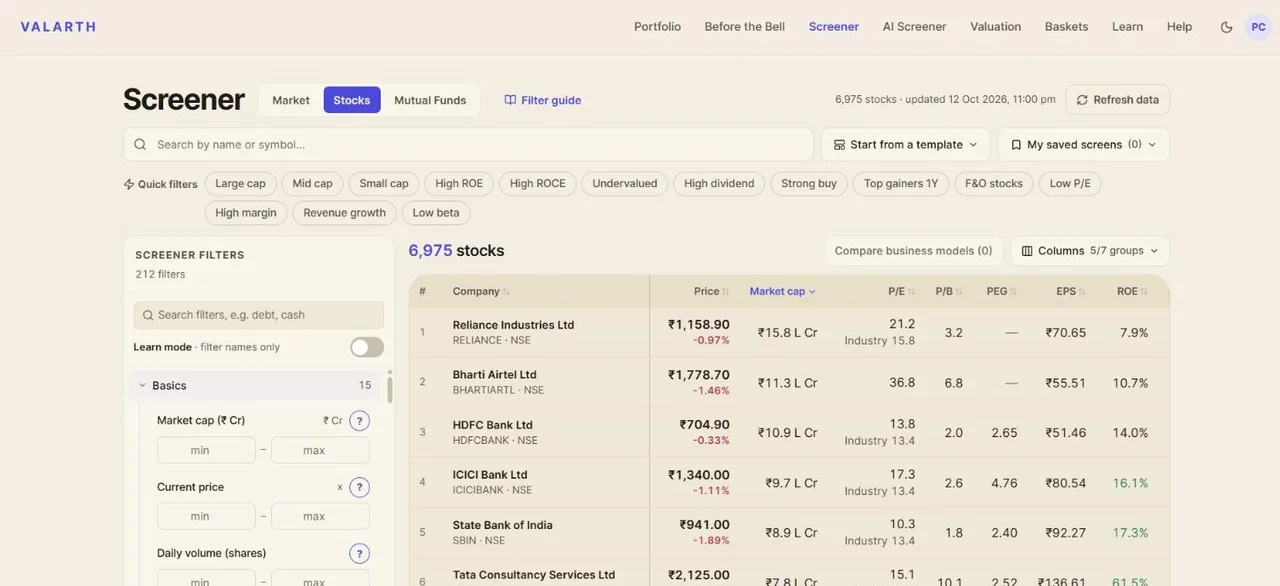
The Valarth stock screener: a table of companies with price, market cap, P/E, P/B, PEG, EPS and ROE, and filters down the left.
ScreenerEvery listed company, filtered on 212 figures, each with a plain-language lesson beside it.
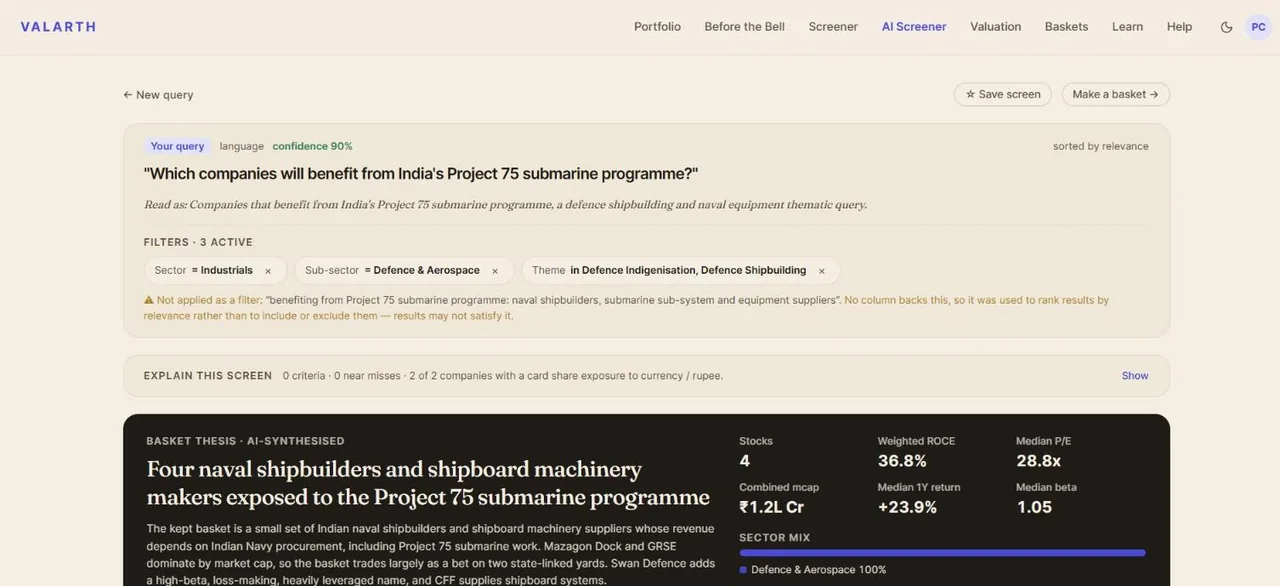
The Valarth AI Screener answering 'Which companies will benefit from India's Project 75 submarine programme?' with a basket of four naval shipbuilders and a written thesis.
AI ScreenerAsk a question in plain English, like which companies benefit from India's Project 75. It reads the intent, builds the screen and writes the thesis.
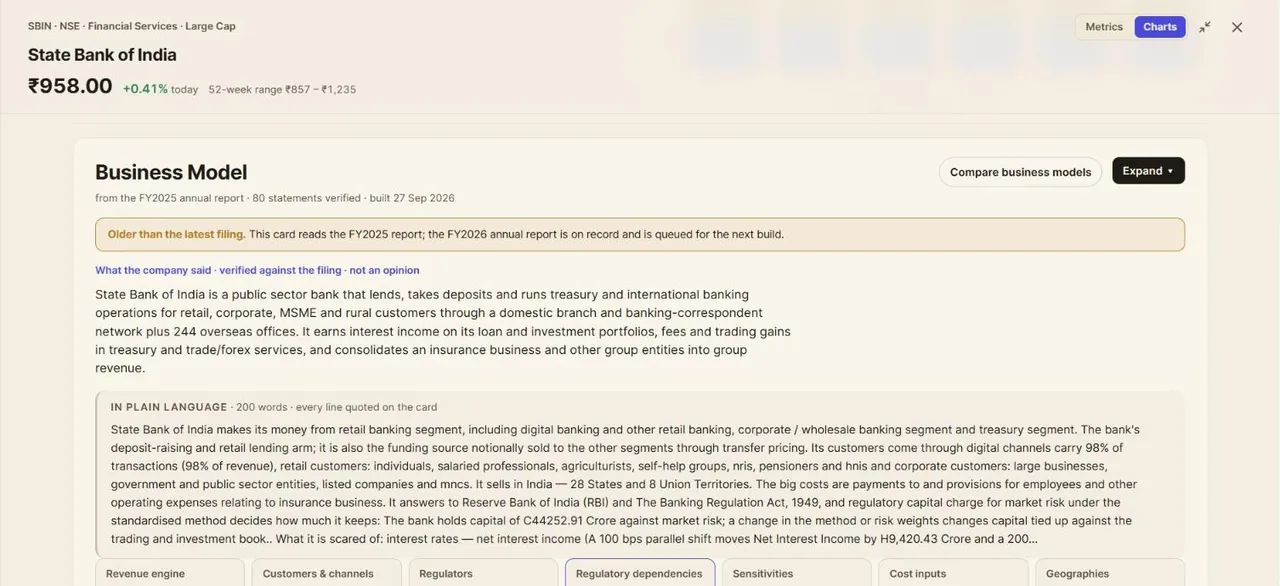
A Valarth business-model card for State Bank of India, with a plain-language summary and statements verified against the filing.
Business modelHow a company makes money and what can hurt it, each statement checked against its annual report.
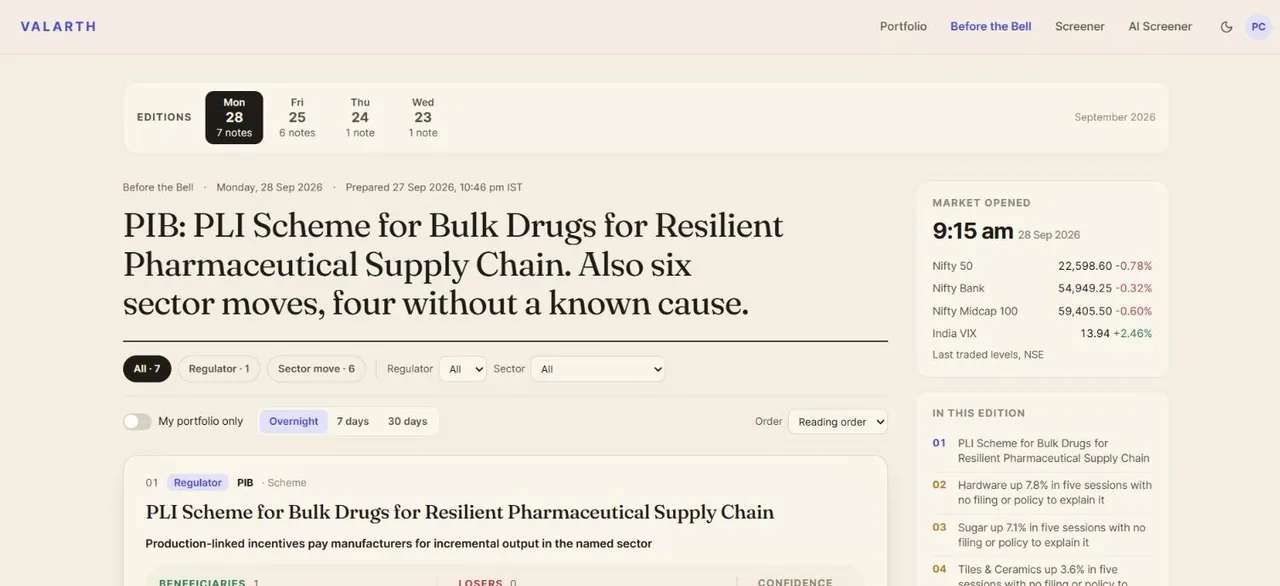
Valarth's Before the Bell edition, with the day's headline, regulator notes and sector moves.
Before the BellA morning edition before the market opens: what moved, which rule changed, and what it means for your holdings.
Share or embed this page
A link posted on X, Reddit, LinkedIn or WhatsApp shows this picture as its preview. The embedded picture always shows the latest figures.

Questions people ask

Who manages and trades India's money?

17 listed companies report their revenue from asset management, broking and exchanges: Indian Bank (INDIANB), Kotak Mahindra Bank Ltd (KOTAKBANK), Motilal Oswal Financial Services Ltd (MOTILALOFS), ICICI Prudential Asset Management Co Ltd (ICICIAMC), Angel One Ltd (ANGELONE), SBI Funds Management Ltd (SBIFUNDS), BSE Ltd (BSE), 360 ONE WAM Ltd (360ONE). 3 more sell them but report them together with other products.

Which listed company earns the most from asset management, broking and exchanges in India?

Indian Bank, with revenue from asset management, broking and exchanges of ₹18,740 crore in FY26: 23.5% of the listed companies' total here.

How much do listed companies earn from asset management, broking and exchanges?

The listed companies here earned ₹79,601 crore from asset management, broking and exchanges in FY26, up 14.4% on FY25. Private makers are not included.

Which listed company makes the most profit from asset management, broking and exchanges?

HDFC Asset Management Company Ltd: its operating profit was 90.3% of its revenue from asset management, broking and exchanges in FY26.

Who owns RIISE?

RIISE is a brand of Motilal Oswal Financial Services Ltd, listed on the NSE as MOTILALOFS.

Who owns MO Alternates?

MO Alternates is a brand of Motilal Oswal Financial Services Ltd, listed on the NSE as MOTILALOFS.

Who owns ARQ Prime?

ARQ Prime is a brand of Angel One Ltd, listed on the NSE as ANGELONE.

Who owns SmartAPI?

SmartAPI is a brand of Angel One Ltd, listed on the NSE as ANGELONE.

Who owns 360 ONE Plus?

360 ONE Plus is a brand of 360 ONE WAM Ltd, listed on the NSE as 360ONE.

Who owns Nuvama Asset Management?

Nuvama Asset Management is a brand of Nuvama Wealth Management Ltd, listed on the NSE as NUVAMA.

Who owns Nuvama Market App?

Nuvama Market App is a brand of Nuvama Wealth Management Ltd, listed on the NSE as NUVAMA.

Who owns HDFC Mutual Fund?

HDFC Mutual Fund is a brand of HDFC Asset Management Company Ltd, listed on the NSE as HDFCAMC.

Who owns HDFC Flexi Cap Fund?

HDFC Flexi Cap Fund is a brand of HDFC Asset Management Company Ltd, listed on the NSE as HDFCAMC.

Who owns iCOMDEX?

iCOMDEX is a brand of Multi Commodity Exchange of India Ltd, listed on the NSE as MCX.