VALARTH Open the screenerOpen in app
Who builds India

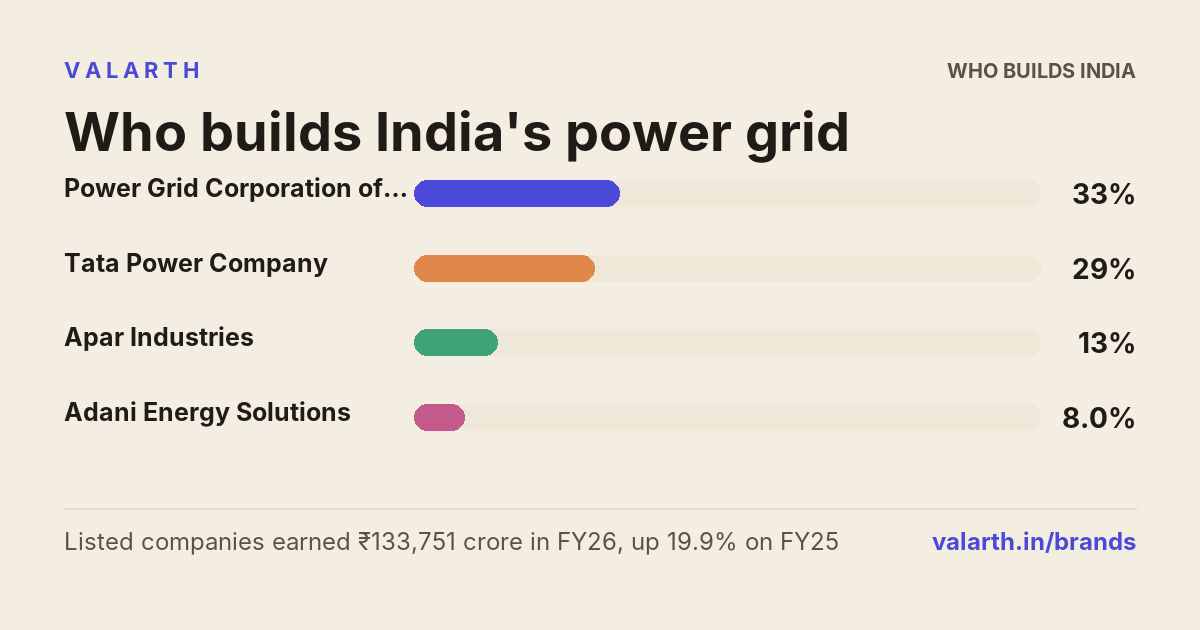
Who builds India's power grid

The listed companies behind it.

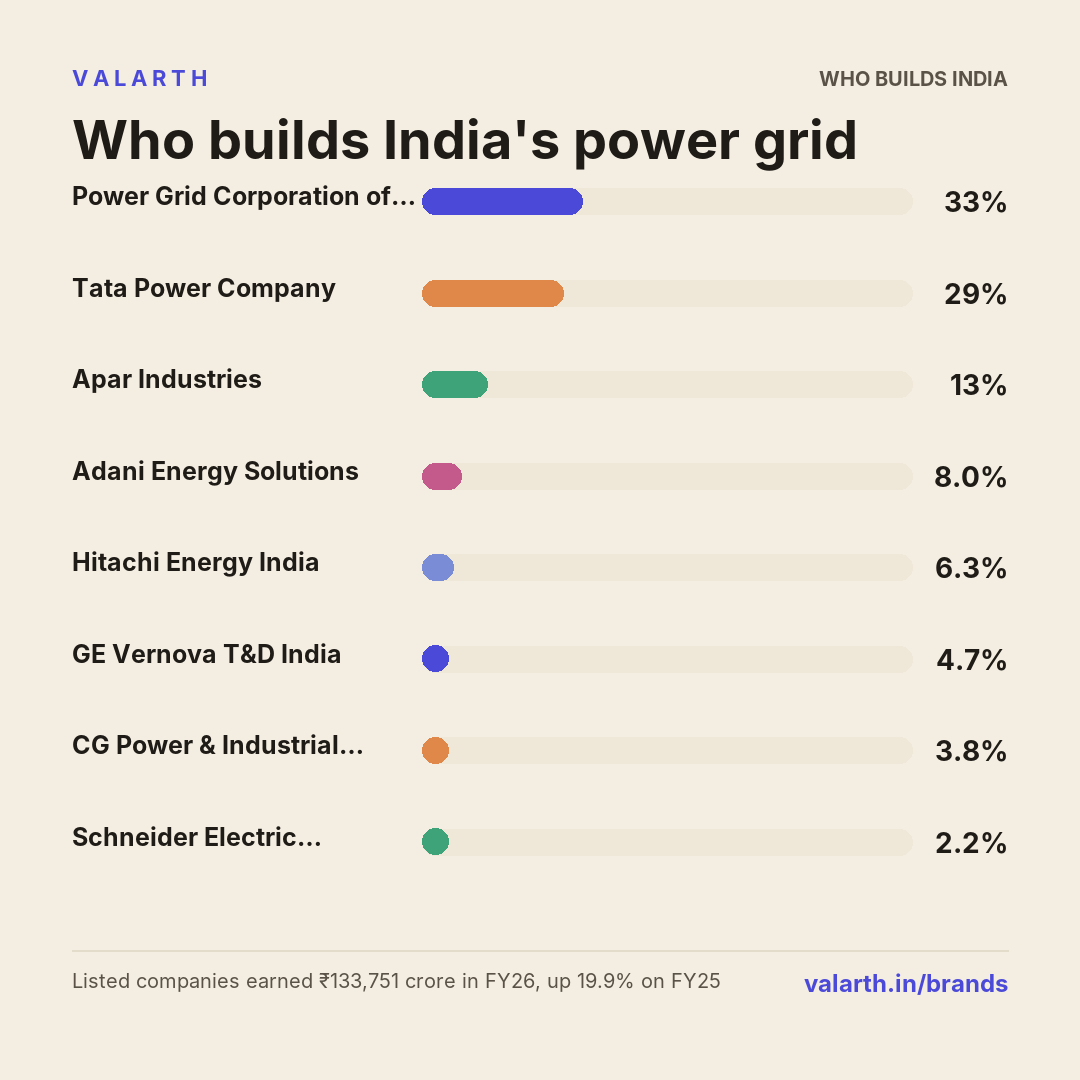
9 listed companies earned ₹133,751 crore from power transmission and grid equipment in FY26, up 19.9% on FY25. Power Grid Corporation of India Ltd earned the most, 32.7% of it. Power Grid Corporation of India Ltd earned the most on each rupee of sales: 60.3%.

Share
Listed companies' sales, FY26
₹133,751 Cr
up 19.9% on FY25
Largest seller
32.7%
Power Grid Corporation of India Ltd
Best margin
60.3%
Power Grid Corporation of India Ltd
Fastest growing, 3 years
+30.9%
GE Vernova T&D India Ltd

The brands, and who owns them

1 brands of power transmission and grid equipment, best known first
Torrent Power LtdNSE: TORNTPOWER
TPGL

TPGL is Torrent Power Ltd's. Brands are read from each company's filings and checked against a public source.

Who sells the most

Share of the listed companies' sales, FY26
Power Grid Corporation of India Ltd₹43,695 Cr · 93% of its sales
32.7%
Tata Power Company Ltd₹38,428 Cr · 62% of its sales
28.7%
Apar Industries Ltd₹17,696 Cr · 77% of its sales Conductor 67% · Power / Telecom cables 33%
13.2%
Adani Energy Solutions Ltd₹10,652 Cr · 39% of its sales Transmission 92% · Smart Meter 8%
8.0%
Hitachi Energy India Ltd₹8,388 Cr · 100% of its sales
6.3%
GE Vernova T&D India Ltd₹6,297 Cr · 100% of its sales
4.7%
CG Power & Industrial Solutions Ltd₹5,136 Cr · 41% of its sales
3.8%
Schneider Electric Infrastructure Ltd₹2,909 Cr · 100% of its sales
2.2%
KEI Industries Ltd₹550 Cr · 5% of its sales
0.4%

Power Grid Corporation of India Ltd had 32.7% of the listed companies' revenue from power transmission and grid equipment here, 1.1 times as much as Tata Power Company Ltd, the next largest. The two together sold 61%; the other 7 the rest.

From each company's own sales figures for this kind of product (its reported segment, or its whole sales where that is all it sells). Private makers are not counted, so this is the split among listed companies, not the whole market.

How the sales have grown, and who sold them

Revenue from power transmission and grid equipment each financial year in ₹ crore (L = lakh crore), the change on the year before above each column
GE Vernova T&D India Ltd, FY19: ₹4,277 Cr3 others, FY19: ₹1,434 Cr ₹5,711 Cr FY19 Hitachi Energy India Ltd, FY20: ₹3,231 CrGE Vernova T&D India Ltd, FY20: ₹3,218 Cr3 others, FY20: ₹1,398 Cr ₹7,847 Cr+37% FY20 Hitachi Energy India Ltd, FY21: ₹3,439 CrGE Vernova T&D India Ltd, FY21: ₹3,522 Cr3 others, FY21: ₹1,316 Cr ₹8,276 Cr+5% FY21 Hitachi Energy India Ltd, FY22: ₹4,987 CrGE Vernova T&D India Ltd, FY22: ₹3,202 Cr3 others, FY22: ₹1,540 Cr ₹9,729 Cr+18% FY22 Hitachi Energy India Ltd, FY23: ₹4,484 CrGE Vernova T&D India Ltd, FY23: ₹2,807 Cr3 others, FY23: ₹1,805 Cr ₹9,096 Cr-7% FY23 Hitachi Energy India Ltd, FY24: ₹5,247 CrGE Vernova T&D India Ltd, FY24: ₹3,190 Cr3 others, FY24: ₹2,216 Cr ₹10,653 Cr+17% FY24 Power Grid Corporation of India Ltd, FY25: ₹44,499 Cr44,499Tata Power Company Ltd, FY25: ₹36,450 Cr36,450Apar Industries Ltd, FY25: ₹4,650 CrAdani Energy Solutions Ltd, FY25: ₹8,331 CrHitachi Energy India Ltd, FY25: ₹6,442 CrGE Vernova T&D India Ltd, FY25: ₹4,355 Cr3 others, FY25: ₹6,823 Cr ₹1.12 lakh Cr+947% FY25 Power Grid Corporation of India Ltd, FY26: ₹43,695 Cr43,695Tata Power Company Ltd, FY26: ₹38,428 Cr38,428Apar Industries Ltd, FY26: ₹17,696 Cr17,696Adani Energy Solutions Ltd, FY26: ₹10,652 Cr10,652Hitachi Energy India Ltd, FY26: ₹8,388 CrGE Vernova T&D India Ltd, FY26: ₹6,297 Cr3 others, FY26: ₹8,595 Cr ₹1.34 lakh Cr+20% FY26
Power Grid Corporation of India LtdTata Power Company LtdApar Industries LtdAdani Energy Solutions LtdHitachi Energy India LtdGE Vernova T&D India Ltd3 others

The listed companies here earned ₹1.34 lakh Cr from power transmission and grid equipment in FY26. Counting only the companies with figures in both years, sales went from ₹5,711 Cr in FY19 to ₹9,206 Cr, 1.6 times as much. The biggest rise was in FY25 (+26%) and the weakest year FY20 (-19%). Power Grid Corporation of India Ltd's part of the total went from 40% in FY25 to 33% in FY26. Over three years GE Vernova T&D India Ltd grew fastest, +30.9% a year. Some companies are counted only from a later year (Power Grid Corporation of India Ltd from FY25; Tata Power Company Ltd from FY25; Apar Industries Ltd from FY25; Adani Energy Solutions Ltd from FY25; Hitachi Energy India Ltd from FY20; CG Power & Industrial Solutions Ltd from FY25; KEI Industries Ltd from FY25).

Counted from the first year their figures for this are available: Power Grid Corporation of India Ltd from FY25; Tata Power Company Ltd from FY25; Apar Industries Ltd from FY25; Adani Energy Solutions Ltd from FY25; Hitachi Energy India Ltd from FY20; CG Power & Industrial Solutions Ltd from FY25; KEI Industries Ltd from FY25. A jump in that year is partly that.

Who earns the most on each rupee

Operating profit as a share of revenue from power transmission and grid equipment, each financial year
-11%25%60%FY19FY20FY21FY22FY23FY24FY25FY26 Power Grid Corporation of India Ltd: 60.2%Power Grid Corporation of India Ltd: 60.3%60.3% Tata Power Company Ltd: 8.8%Tata Power Company Ltd: 11.4%11.4% Apar Industries Ltd: 9.9%Apar Industries Ltd: 9.0%9.0% Adani Energy Solutions Ltd: 41.2%Adani Energy Solutions Ltd: 40.7%40.7% Hitachi Energy India Ltd: 6.8%Hitachi Energy India Ltd: 4.0%Hitachi Energy India Ltd: 5.5%Hitachi Energy India Ltd: 2.9%Hitachi Energy India Ltd: 4.2%Hitachi Energy India Ltd: 8.0%Hitachi Energy India Ltd: 15.7%15.7% GE Vernova T&D India Ltd: 7.8%GE Vernova T&D India Ltd: -11.1%GE Vernova T&D India Ltd: 2.5%GE Vernova T&D India Ltd: -2.2%GE Vernova T&D India Ltd: 1.0%GE Vernova T&D India Ltd: 8.2%GE Vernova T&D India Ltd: 18.8%GE Vernova T&D India Ltd: 26.2%26.2%
Power Grid Corporation of India LtdTata Power Company LtdApar Industries LtdAdani Energy Solutions LtdHitachi Energy India LtdGE Vernova T&D India Ltd

Operating profit before interest and tax, as a share of revenue from power transmission and grid equipment. Power Grid Corporation of India Ltd earned 60.3% on its sales in FY26, against 60.2% in FY25. Tata Power Company Ltd earned 11.4% on its sales in FY26, against 8.8% in FY25. Apar Industries Ltd earned 9.0% on its sales in FY26, against 9.9% in FY25. Adani Energy Solutions Ltd earned 40.7% on its sales in FY26, against 41.2% in FY25. Hitachi Energy India Ltd earned 15.7% on its sales in FY26, against 6.8% in FY20. GE Vernova T&D India Ltd earned 26.2% on its sales in FY26, against -1.7% in FY17.

The companies, and their brands

Company and brandsSales FY26Growth 1 yr3 yrs5 yrsMarginProfit shareReturn on assetsP/EROEShare price 1 yr
Power Grid Corporation of India Ltd ₹43,695 Cr -1.8% — — 60.3% 64.2% 11.4% 14.7 16.6% -12.9%
Tata Power Company Ltd
Sells in 19 states and 7 countries; exports 0.3% of turnover
₹38,428 Cr +5.4% — — 11.4% 10.7% 8.2% 28.5 6.1% -11.9%
Apar Industries Ltd
Sells in 36 states and 140 countries; exports 29.77% of turnover
₹17,696 Cr +280.9% — — 9.0% 3.9% 14.7% 61.2 20.6% +111.7%
Adani Energy Solutions Ltd ₹10,652 Cr +27.9% — — 40.7% 10.5% 7.9% 53.4 2.8% +38.9%
Hitachi Energy India Ltd ₹8,388 Cr +30.2% +23.2% — 15.7% 3.2% — 117.2 21.0% +73.3%
GE Vernova T&D India Ltd ₹6,297 Cr +44.6% +30.9% +12.3% 26.2% 4.0% — 82.2 55.3% +40.6%
CG Power & Industrial Solutions Ltd
Sells in 27 states and 20 countries; exports 4.0% of turnover
₹5,136 Cr +46.4% — — 21.9% 2.7% 36.8% 107.6 21.4% +14.5%
Schneider Electric Infrastructure Ltd
Sells in 28 states and 49 countries; exports 11.0% of turnover
₹2,909 Cr +8.6% +17.2% +17.2% 10.0% 0.7% — 157.2 36.4% +48.1%
KEI Industries Ltd ₹550 Cr -13.5% — — 3.5% 0.0% 4.1% 44.5 14.8% +6.4%
Brands are read from each company's filings and checked against a public source. Growth is the yearly rate of its revenue from power transmission and grid equipment. Margin is the operating profit (before interest and tax) the company reports on them, as a share of those sales; profit share is its part of all the listed companies' profit on them; return on assets is that profit against the assets it reports for them. A company with no other business is measured on its whole accounts. Where a company's segments include sales between its own businesses (a bank's treasury lending to its retail arm), each segment is scaled down in proportion so that together they match what the company earns outside itself; companies report those internal sales only as a total. Not a recommendation to buy or sell.

Also sold by

These companies report this together with other businesses, so their figures are not counted above
Inside the app

See every one of these companies in Valarth
Start freeStart free
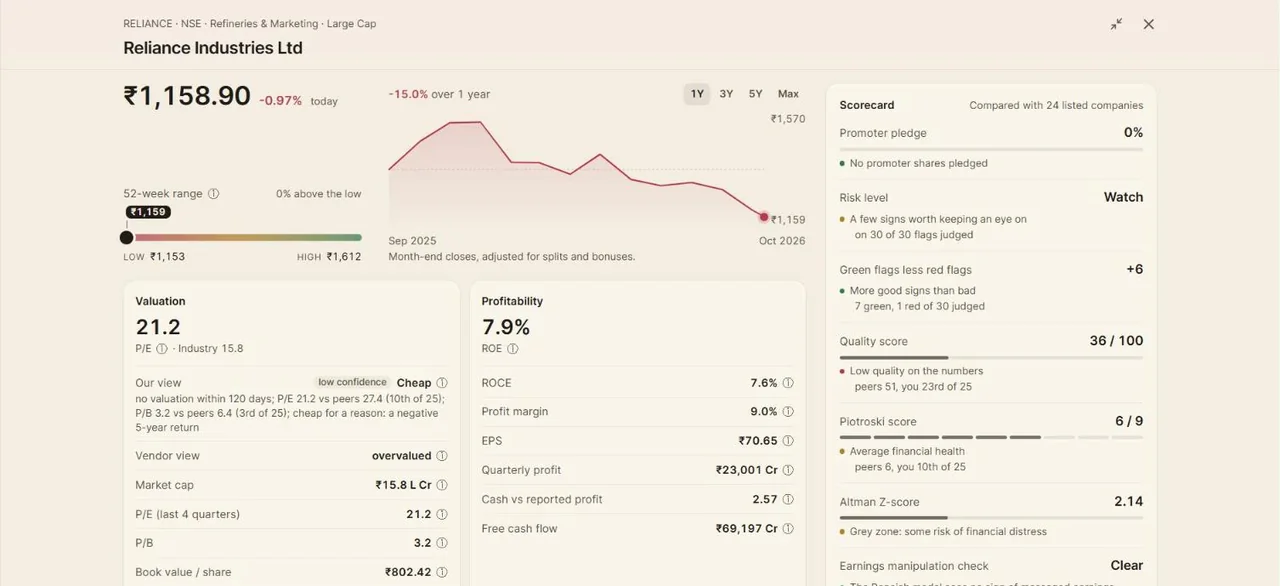
A Valarth stock page: the share price with its chart and 52-week range, valuation and profitability figures, and a scorecard of health checks.
Stock pagePrice, valuation, profitability and a scorecard of health checks for every company, each figure explained.
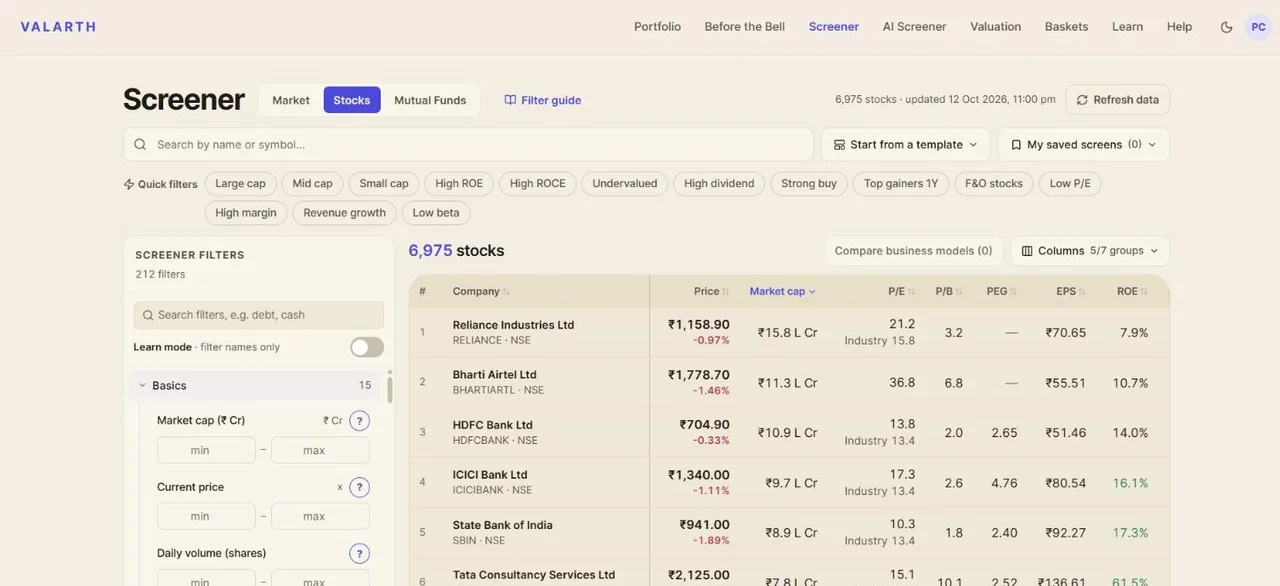
The Valarth stock screener: a table of companies with price, market cap, P/E, P/B, PEG, EPS and ROE, and filters down the left.
ScreenerEvery listed company, filtered on 212 figures, each with a plain-language lesson beside it.
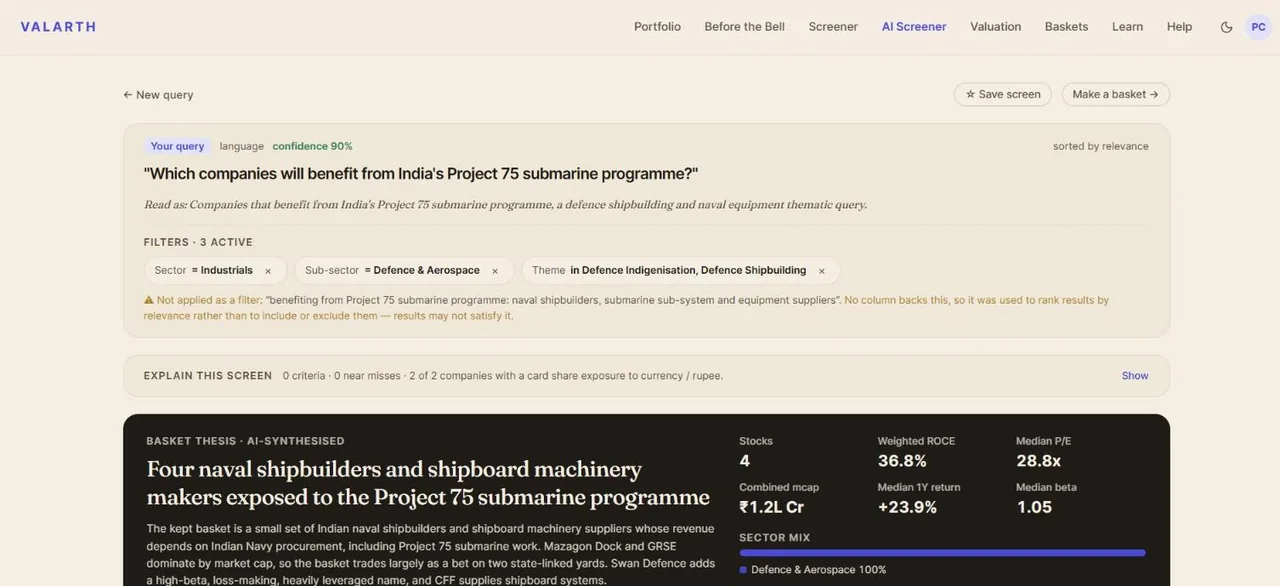
The Valarth AI Screener answering 'Which companies will benefit from India's Project 75 submarine programme?' with a basket of four naval shipbuilders and a written thesis.
AI ScreenerAsk a question in plain English, like which companies benefit from India's Project 75. It reads the intent, builds the screen and writes the thesis.
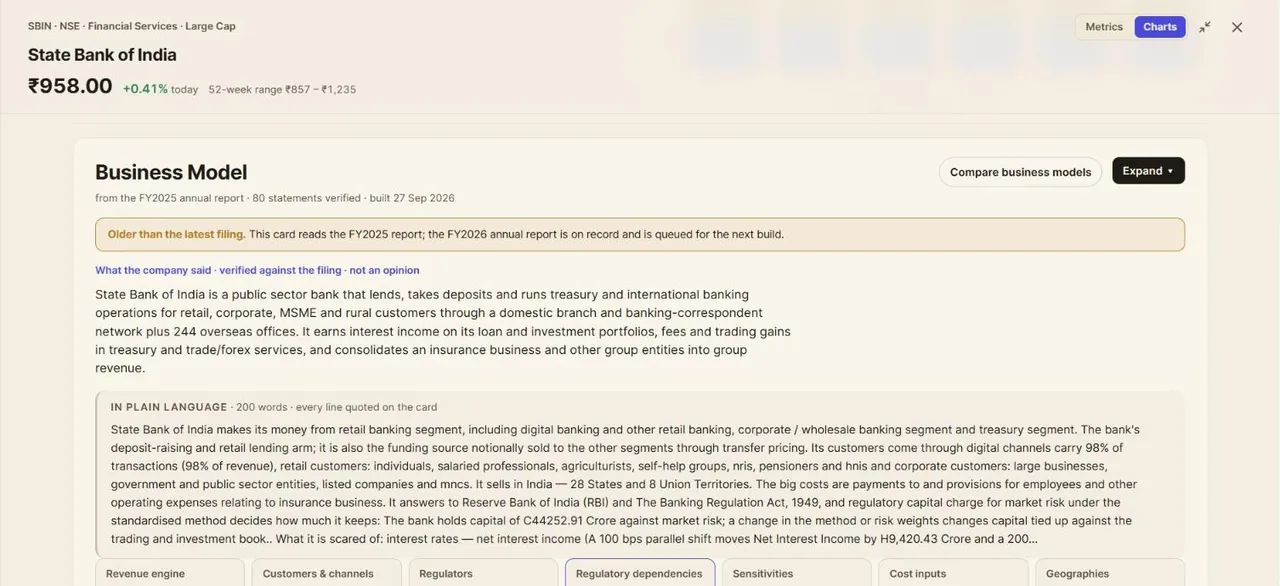
A Valarth business-model card for State Bank of India, with a plain-language summary and statements verified against the filing.
Business modelHow a company makes money and what can hurt it, each statement checked against its annual report.
Valarth's Before the Bell edition, with the day's headline, regulator notes and sector moves.
Before the BellA morning edition before the market opens: what moved, which rule changed, and what it means for your holdings.
Share or embed this page
A link posted on X, Reddit, LinkedIn or WhatsApp shows this picture as its preview. The embedded picture always shows the latest figures.

Questions people ask

Who builds India's power grid?

9 listed companies report their revenue from power transmission and grid equipment: Power Grid Corporation of India Ltd (POWERGRID), Tata Power Company Ltd (TATAPOWER), Apar Industries Ltd (APARINDS), Adani Energy Solutions Ltd (ADANIENSOL), Hitachi Energy India Ltd (POWERINDIA), GE Vernova T&D India Ltd (GVT&D), CG Power & Industrial Solutions Ltd (CGPOWER), Schneider Electric Infrastructure Ltd (SCHNEIDER). 6 more sell them but report them together with other products.

Which listed company earns the most from power transmission and grid equipment in India?

Power Grid Corporation of India Ltd, with revenue from power transmission and grid equipment of ₹43,695 crore in FY26: 32.7% of the listed companies' total here.

How much do listed companies earn from power transmission and grid equipment?

The listed companies here earned ₹133,751 crore from power transmission and grid equipment in FY26, up 19.9% on FY25. Private makers are not included.

Which listed company makes the most profit from power transmission and grid equipment?

Power Grid Corporation of India Ltd: its operating profit was 60.3% of its revenue from power transmission and grid equipment in FY26.