VALARTH See ITC in the appOpen in app
ITC · NSE · Diversified FMCG

ITC Ltd

What the numbers mean, from its filings and the exchange. Data as of 12 Oct 2026.
Large Cap · AMFI list Jan-Jun 2026 · Vendor sector: Consumer Defensive
cheap low confidence No valuation within 120 days; P/E 16.8 vs peers 48.8 (1st of 9); P/B 5.2 vs peers 11.5 (1st of 9).
Cheap for a reason: A negative 5-year return.
Statements through FY2026Prices adjusted for 2 corporate actionsNot yet reviewed by the adversarial model

What is ITC's share price today?

ITC last traded at ₹257.90 on the NSE, as of 12 Oct 2026, 11:00 pm IST, down 3.0% on the day, down 33.4% over a year. Its 52-week range is ₹253 to ₹426. The live price is in the app.

₹257.90 −3.0% today
−33.4% over 1 year · NSE, as of 12 Oct 2026, 11:00 pm IST
60 month-end closes, 31 Oct 2021 to 30 Sep 2026, adjusted for splits and bonuses
52-week range3% of the way up
Low ₹253High ₹426

What is ITC's market cap?

ITC's market capitalisation is about ₹3.33 lakh crore: what it would cost to buy every share at today's price. That makes it the 22nd largest large cap company we cover.

₹3.3 L Cr Large Cap22nd largest large cap company
Large Cap means the 100 largest listed companies, under SEBI's rules. Shares in issue are worked out from the market cap and the price. What market cap tells you →

Key facts

From the exchange
Symbol
NSE: ITC
ISIN
INE154A01025
Cap bucket
Large Cap, 22nd largest by market cap
Industry (NSE)
Fast Moving Consumer Goods › Diversified FMCG
Listed since
1995
Futures and options
Traded

Is ITC overvalued?

Cheap, with low confidence: no valuation within 120 days; P/E 16.8 vs peers 48.8 (1st of 9); P/B 5.2 vs peers 11.5 (1st of 9). Cheap for a reason: A negative 5-year return.

Valuation

Latest price and trailing 12 months
P/E 16.79
vs peers 48.8 · 1st of 9
Price divided by last year's earnings per share: how many years of today's profit you pay for. Learn more →
P/B 5.15
vs peers 11.5 · 1st of 9
Price divided by book value per share: what you pay for each rupee of net assets on the balance sheet. Learn more →
Market cap ₹3.33 lakh Cr
Total market value of all shares, in ₹ crore. Learn more →
Dividend yield Not available
Last year's dividends as a share of today's price. Learn more →
PEG (vendor) Not available
P/E divided by the vendor's earnings growth figure, which it does not disclose; a P/E adjusted for how fast profits grow. Learn more →
PEG on our 3-year EPS growth 4.16
P/E divided by the 3-year EPS growth rate from the stored accounts. Learn more →
3 models could be judged
Skipped — Fair value, EPV, Graham number, Graham value, Lynch, Owner earnings: no valuation stored

Our valuation range

🔒 Pro
Value range, implied growth at today's price, and the nine models behind it: in the app.

Is ITC a quality business?

Quality score 44, 6th of 9 in its peer set; WATCH on 21 of 30 flags judged.

Quality and risk

Data as of 12 Oct 2026
Business quality Not available
The kind of business, which sets the yardstick it is judged by. Learn more →
Quality score 44
vs peers 53.9 · 6th of 9
Returns, margins, leverage and consistency against its peers, out of 100. Learn more →
Risk level WATCH
21 of 30 flags judged
From flags on debt, earnings quality, dilution and price swings. Learn more →

Profitability

ROE 29.4%
vs peers 26.5% · 5th of 9
Return on equity: profit as a share of shareholders' money. Learn more →
ROCE 38.0%
vs peers 26.8% · 4th of 9
Return on capital employed: operating profit as a share of all the capital in the business, debt and equity. Learn more →
Profit margin 24.9%
vs peers 13.5% · 1st of 9
Profit after everything, as a share of revenue. Learn more →
EPS ₹16.77
Trailing 12 months
Profit for each share over the last 12 months.

Scorecard

🔒 Pro
Health scores and red flags with their values and history: in the app.
Inside the app

Get a sneak peek of Valarth

Start freeStart free
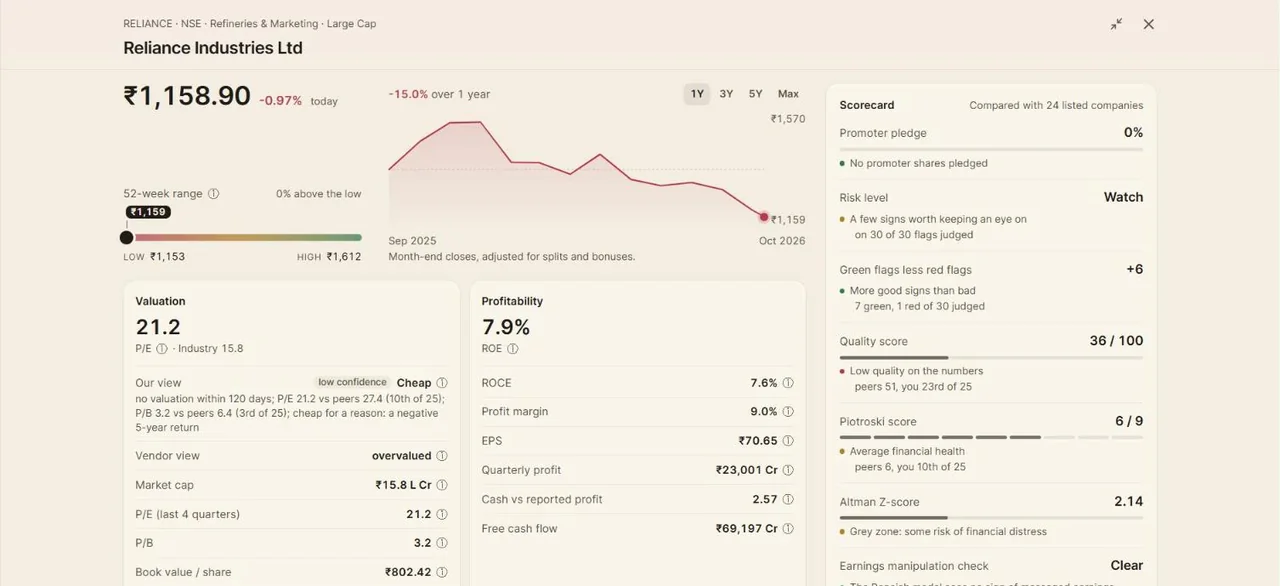
A Valarth stock page: the share price with its chart and 52-week range, valuation and profitability figures, and a scorecard of health checks.
Stock pagePrice, valuation, profitability and a scorecard of health checks for every company, each figure explained.
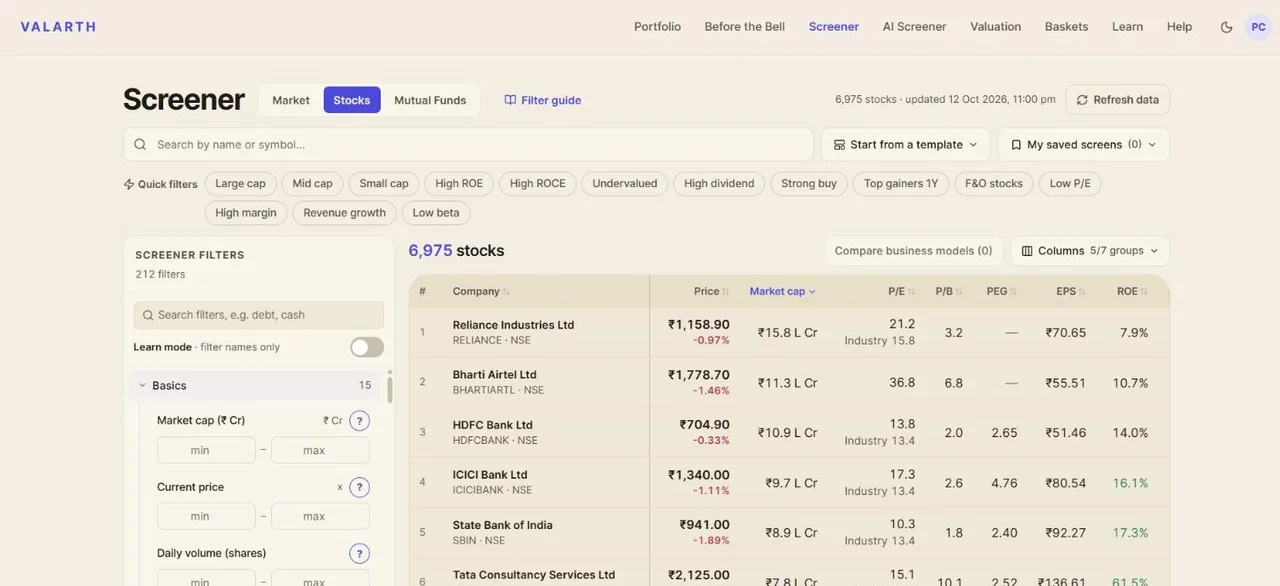
The Valarth stock screener: a table of companies with price, market cap, P/E, P/B, PEG, EPS and ROE, and filters down the left.
ScreenerEvery listed company, filtered on 212 figures, each with a plain-language lesson beside it.
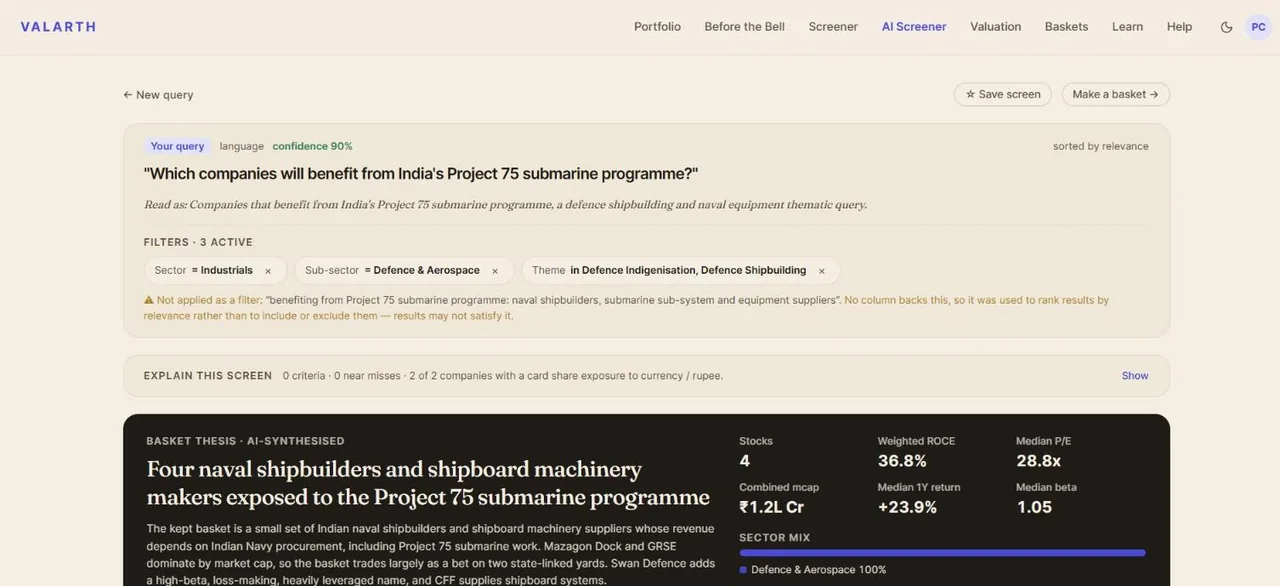
The Valarth AI Screener answering 'Which companies will benefit from India's Project 75 submarine programme?' with a basket of four naval shipbuilders and a written thesis.
AI ScreenerAsk a question in plain English, like which companies benefit from India's Project 75. It reads the intent, builds the screen and writes the thesis.
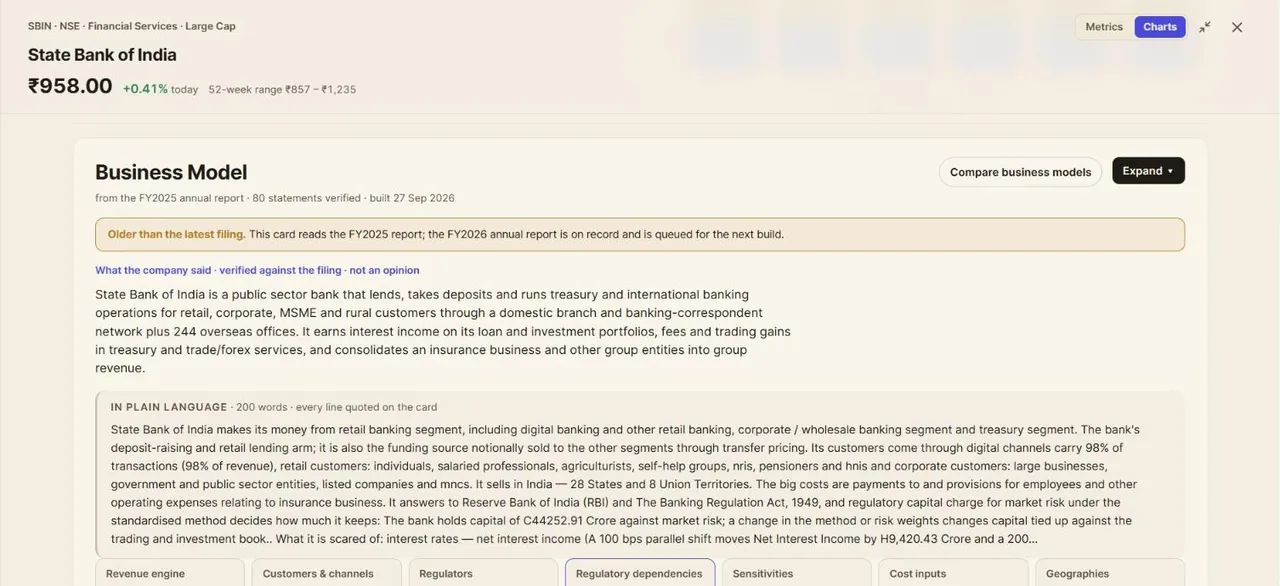
A Valarth business-model card for State Bank of India, with a plain-language summary and statements verified against the filing.
Business modelHow a company makes money and what can hurt it, each statement checked against its annual report.
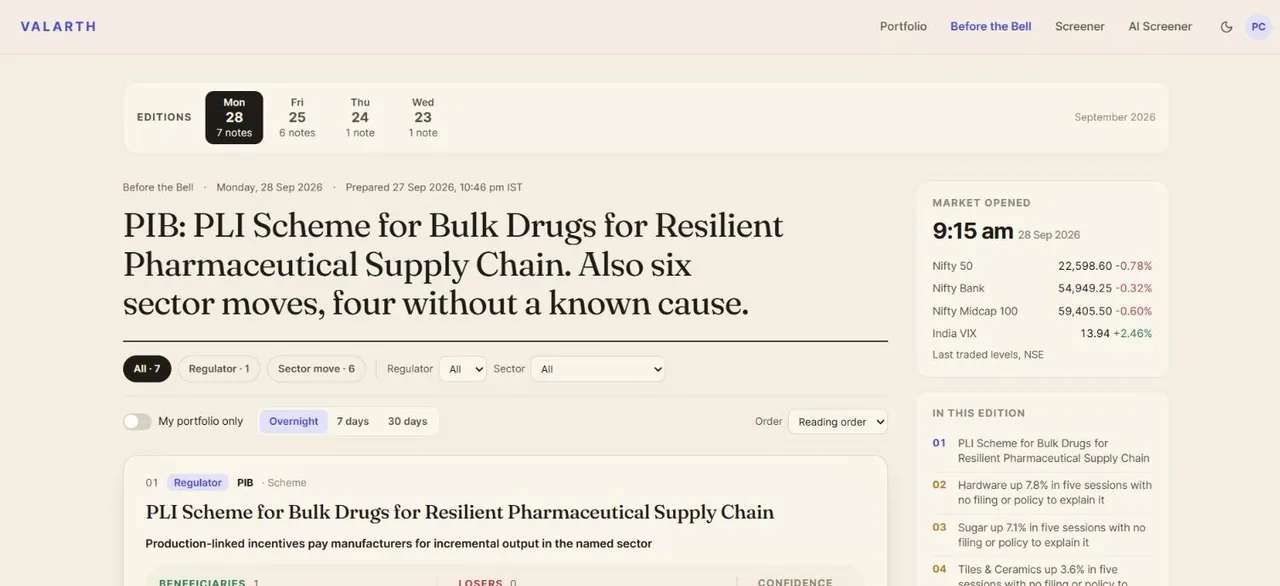
Valarth's Before the Bell edition, with the day's headline, regulator notes and sector moves.
Before the BellA morning edition before the market opens: what moved, which rule changed, and what it means for your holdings.

Has ITC made money for shareholders?

Mixed: −33.4% over one year and +2.2% a year over five years.

Shareholder returns

1-year return −33.4%
Price only
What the share price did over the last 12 months. Learn more →
5-year return +2.2% a year
Price only
Yearly average price return over five years, bonuses and splits adjusted. Learn more →
Wealth destroyer Yes
Five-year total return — price CAGR on bonus- and split-adjusted closes plus the dividend yield — below the 7% a bank fixed deposit paid. Learn more →

Returns

3Y and 5Y are yearly averages
1W
−1.1%
1M
+3.1%
3M
−4.9%
6M
−10.9%
1Y
−33.4%
3Y
−15.0%
5Y
+2.2%

Does ITC pay a dividend?

ITC last paid ₹8.00 a share, ex-dividend 27 May 2026; nothing in the past 12 months counts toward a yield.

Dividends

Per share, by ex-dividend date
27 May 2026 · Final₹8.00
4 Feb 2026 · Interim₹6.50
28 May 2025 · Final₹7.85
12 Feb 2025 · Interim₹6.50
4 Jun 2024 · Final₹7.10
Payout ratio🔒 In the app
The share of profit paid out as dividends; a very high share leaves little to reinvest.
Dividend growth, 5 years🔒 In the app
How fast the dividend per share has grown a year.
Years without a miss🔒 In the app
How many years in a row a dividend has been paid.

Is ITC growing?

Revenue 3 years 3.8% a year; profit 3 years 2.5% a year; revenue 5 years 5.0% a year. History break: demerger 2025-01-06 in the 3- and 5-year growth figures.

Growth

Statements through FY2026 (Mar-26)
Revenue 3 years 3.8% a year
vs peers 7.8% · 9th of 9
Compound annual growth of revenue over three years. Learn more →
History break: Demerger 2025-01-06 in the 3- and 5-year growth figures.
Profit 3 years 2.5% a year
vs peers 9.6% · 9th of 9
Compound annual growth of net profit over three years. Learn more →
History break: Demerger 2025-01-06 in the 3- and 5-year growth figures.
Revenue 5 years 5.0% a year
Compound annual growth of revenue over five years. Learn more →
History break: Demerger 2025-01-06 in the 3- and 5-year growth figures.
Profit 5 years 5.4% a year
Compound annual growth of net profit over five years. Learn more →
History break: Demerger 2025-01-06 in the 3- and 5-year growth figures.
EPS 3 years 4.0% a year
Growth in earnings per share, so dilution counts against the company. Learn more →
History break: Demerger 2025-01-06 in the 3- and 5-year growth figures.
EPS 5 years 10.3% a year
Growth in earnings per share over five years, so dilution counts against the company. Learn more →
History break: Demerger 2025-01-06 in the 3- and 5-year growth figures.
P/E vs own history -40.0%
vs peers -19.8% · 2nd of 8
Today's P/E against its own 5-year median; negative is cheaper than its history. Learn more →
History break: Demerger 2025-01-06 in the 3- and 5-year growth figures.

How did ITC do last quarter?

ITC reported revenue of ₹19,001 Cr, up 4.7% on a year earlier and a net profit of ₹4,509 Cr, down 40.0% in the Jun 2026 quarter.

Latest quarter

Jun 2026
Revenue, latest quarter₹19,001 Cr
+4.7% on a year earlier
What the company took in over the quarter.
Net profit, latest quarter₹4,509 Cr
−40.0% on a year earlier
What was left for shareholders after every cost and tax.

How does ITC compare with its peers?

Compared with 8 Fast Moving Consumer Goods (the sector, as the industry was too small); 1st of 9 on P/E; 6th of 9 on quality score.

Compared with 8 Fast Moving Consumer Goods (the sector, as the industry was too small)

8 companies

ITC against its peers

Largest 8 of 8 peers, by market cap
CompanyMarket capP/EP/BROEROCE1YQuality 🔒Rank 🔒
ITC Ltd₹3.3 L Cr16.85.229.4%38.0%−33.4%
Hindustan Unilever Ltd₹4.4 L Cr29.29.831.0%25.2%−25.5%
Nestle India Ltd₹2.6 L Cr67.442.775.2%56.1%+12.2%
Varun Beverages Ltd₹1.5 L Cr44.18.815.2%19.4%−0.3%
Britannia Industries Ltd₹1.2 L Cr44.628.260.1%60.6%−17.7%
Marico Ltd₹1.0 L Cr53.916.537.0%41.7%+10.2%
United Spirits Ltd₹99,356 Cr51.510.122.1%28.5%+3.8%
Tata Consumer Products Ltd₹94,516 Cr57.85.69.4%11.7%−14.5%
Godrej Consumer Products Ltd₹88,055 Cr46.012.818.7%20.2%−22.5%
Peer median—48.811.526.5%26.8%−7.4%
Market cap in rupees crore; P/E and P/B on the latest price; 1Y is the price return over a year. A dash is a figure that does not apply or is not reported.

Full peer comparison

🔒 Pro
Every peer, every figure, the ranks and the quality and forensic scores side by side: in the app.

Who owns ITC?

ITC has no promoter holding; it is widely held.

Shareholding pattern

Latest filing, percent of shares
Promoters0.0%
The founders and controlling group.
Foreign institutions34.2%
Overseas funds investing through the FPI route.
Domestic institutions49.1%
Indian insurers, banks, pension and mutual funds together.
Mutual funds16.5%
Indian mutual fund schemes; part of domestic institutions.
Retail and others12.4%
Individual investors and everyone else.
Promoter shares pledged🔒 In the app
Promoter shares given as collateral for loans; a high share is a risk to watch.
Holding trend🔒 In the app
Whether promoters, foreign funds and mutual funds have been adding or selling over recent quarters.

What do analysts say about ITC?

34 analysts cover ITC, and the consensus is buy. A consensus is a count of opinions, not a forecast; read it beside the numbers.

Analyst consensus

34 analysts
ConsensusBuy
The rating most covering analysts give the share.
Average target price🔒 In the app
The mean of the analysts' 12-month price targets.
Upside to target🔒 In the app
How far the target sits above or below today's price.
Share rating it a buy🔒 In the app
The share of covering analysts with a buy rating.

What does ITC do and what is it sensitive to?

ITC Limited is a diversified Indian conglomerate with businesses in FMCG (cigarettes, packaged foods, personal care, matches, agarbattis), Paperboards & Specialty Papers, Packaging & Printing, and Agri commodities. Sensitive to: monsoon and weather patterns.

Business-model card

FY2025 · 69 verified
5Revenue
8Channels
4Regulators
6Reg. dependencies
8Sensitivities
6Costs
1Geographies

ITC Limited is a diversified Indian conglomerate with businesses in FMCG (cigarettes, packaged foods, personal care, matches, agarbattis), Paperboards & Specialty Papers, Packaging & Printing, and Agri commodities. It earns revenue through branded consumer products sold via multi-channel distribution (retail, modern trade, e-commerce), paperboard and packaging sales to converters and end-users, and agri-commodity trading and procurement.

Revenue by segment

year ended March 31, 2025 (Consolidated)
FMCG - Cigarettes44.3%
FMCG - Others27.2%
Agri Business15.1%
Paperboards, Paper and Packaging8.1%
Others5.2%

Revenue engine

5 verified
FMCG - Others: Branded Packaged Foods (29.9%)
Portfolio of over 25 world-class Indian brands across staples, meals, snacks, dairy, beverages, biscuits, cakes, chocolates, coffee, confectionery; reaches over 260 million households; represents annual consumer spend of over ₹34,000 Cr.
FMCG - Others: Personal Care Products, Education & Stationery, Safety Matches, Agarbattis
Range of personal care, educational and stationery products, safety matches and incense sticks sold under established brands with growing market standing.
Agri Business (16.4%)
Procurement, processing and trading of agri-commodities including wheat, rice, spices, coffee, soya and leaf tobacco; external revenue ₹12,065.64 Cr (FY2025); inter-segment sales ₹7,688.16 Cr to other FMCG and manufacturing businesses.
2 more statements
Paperboards, Paper and Specialty Papers
Manufacture of paperboards and specialty papers with in-house pulp production capability; external revenue ₹6,626.23 Cr (FY2025); inter-segment sales of ₹1,796.58 Cr to Packaging & Printing and other businesses.
Packaging and Printing
Leading provider of value-added, differentiated and innovative packaging solutions leveraging multiple technology platforms for cartons and laminates, with in-house cylinder making and blown film manufacturing.

Customers & channels

8 verified
General Trade / Traditional Retail
Indirect distribution through traditional retail outlets in both urban and rural markets; Company serviced more than one-third of nearly 7 million retail outlets directly; faced regional/local competition and channel shift to modern and quick commerce.
Modern Trade and E-Commerce
Strategic channel focus driving accelerated growth; rapid scale-up achieved through channel-specific packs, launches and agile execution; omni-channel presence in urban markets enabled rapid growth.
Quick Commerce
Emerging high-growth channel requiring tailored market/outlet-specific strategies and rapid supply chain response to meet demand volatility.
5 more statements
Food Service and Institutional channels
Robust growth through partnerships with QSRs, railways, airports and airlines; customised product portfolios deployed for high-potential segments including on-the-go consumption and direct marketing.
Rural markets via hub-and-spoke distribution
Rural stockist network expanded 1.4x over three years leveraging deep rural connect of Agri Business; market-specific interventions based on socio-economic indicators; extensive consumer activations and market development activities.
B2B via UNNATI eB2B platform
Digitally-powered platform scaled up during the year covering nearly 8 lakh outlets; facilitates direct engagement with retailers, superior analytics, personalised hyperlocal basket recommendations and brand engagement.
Export markets across 70+ countries
FMCG Businesses expanding export footprint leveraging equity of world-class brands; reach spanning over 70 countries; exploring strategic opportunities in proximal markets.
B2B converters and end-users (Paperboards, Paper & Packaging)
Supply of paperboards, specialty papers and packaging solutions to converters and end-use industries; customer base limits credit concentration risk.

Regulators

4 verified
Tobacco Board
Governs tobacco cultivation, manufacturing, trade and related activities under Tobacco Board Act, 1975.
Ministry of Health/Central Government (Cigarettes & Tobacco)
Enforces Cigarettes and Other Tobacco Products (Prohibition of Advertisement and Regulation of Trade and Commerce, Production, Supply and Distribution) Act, 2003 governing manufacture, sale, advertisement and distribution of tobacco products.
Food Safety and Standards Authority (FSSAI)
Regulates safety, quality and labelling of packaged foods under Food Safety and Standards Act, 2006.
1 more statement
Drugs Controller General and State Drug Authorities
Regulate cosmetic products and personal care items under Drugs and Cosmetics Act, 1940.

Regulatory dependencies

6 verified
Cigarettes excise and duties (Excise Duty, NCCD)
Excise duties and National Calamity Contingent Duty are payable on manufacture of cigarettes; these are included in revenue but reduce net realisable value and profitability of cigarette segment (44.42% of total turnover).
Tobacco advertising and distribution restrictions (COTPA 2003)
Prohibition on tobacco product advertisement and strict regulation of trade, commerce and distribution affects go-to-market strategy, brand communication and channel selection for cigarette business.
Food safety and labelling standards (FSSA 2006)
Packaged foods must comply with safety standards and labelling requirements, affecting product formulation, packaging, claims and market approval timelines for FMCG-Others segment (29.91% of turnover).
3 more statements
Cosmetics and personal care regulation (Drugs & Cosmetics Act 1940)
Personal Care Products must meet safety, quality and labelling standards; affects product development, testing, approval and go-to-market timelines.
GST and VAT on FMCG products (excl. from revenue)
Value Added Tax and Goods and Services Tax are payable on sale and excluded from revenue; changes in tax rates or classification directly impact net realised price and margins.
Environmental and sustainability regulations (packaging, emissions, water, waste)
Regulations on single-use plastics, sustainable packaging, emissions limits, water usage and waste disposal affect manufacturing costs, product design and supply chain viability for all segments.

Sensitivities

8 verified
Monsoon and weather patterns
Good monsoon supports recovery in rural demand and agri output; poor monsoon disrupts crop cycles, agri supply chains, reduces commodity availability and quality, impacting Agri Business revenue and FMCG input costs.
Inflation and consumer price inflation
Inflationary pressures reduce household savings and weigh on consumption expenditure, particularly in urban markets; inflation moderating supports recovery in private consumption; impacts demand for FMCG products.
Commodity price volatility (crude oil, agricultural inputs, pulp)
Commodity price volatility impacts input costs (energy, raw materials, agri inputs, pulp); unprecedented volatility in commodity prices intensified margin pressures; hedging via futures contracts used for select commodities.
5 more statements
Rural versus urban consumption patterns
Rural demand was resilient despite urban demand weakness in FY2024-25; recovery in rural demand expected to lead growth going forward; affects FMCG volume mix and distribution strategy.
Interest rate cuts and monetary policy
Lower interest rates and liquidity support from RBI support growth and consumption; positive for consumer discretionary spending and working capital management.
Exchange rate fluctuations (USD, other currencies)
For every 1% change in underlying FX rate of outstanding foreign currency assets/liabilities, profit before tax would change by ₹0.68 Cr and equity by ₹10.30 Cr (pre-tax); export revenue spans 70+ countries and subject to FX exposure.
Disposable income growth and urbanisation
Rising disposable incomes and rapid urbanisation drive demand for branded FMCG products and premium segments; low penetration levels offer headroom for growth.
Climate change impacts (physical risks)
Extreme weather events, erratic precipitation, water scarcity and changes to soil/biodiversity disrupt agri supply chains, reduce output quality, impact crop cycles and operations; affects agri business and input availability.

Cost inputs

6 verified
Agricultural commodities (wheat, potato, fruit pulp, spices, milk, leaf tobacco)
Key raw materials for FMCG and agri businesses; backward integration strategy via direct sourcing from suppliers ensures benchmark quality and competitive cost; subject to seasonal availability and commodity price volatility.
Pulp (imported and in-house production)
Key input for Paperboards & Specialty Papers business; in-house pulp manufacturing capability and imported pulp substitution strategy reduces cost and dependency; subject to global pulp prices.
Freight and handling (outward logistics)
Outward freight and handling charges ₹1,891.85 Cr (FY2025); critical cost driver affecting margin; supply chain delayering and direct-to-market shipments reduce freight costs.
3 more statements
Contract processing and manufacturing
Contract processing charges ₹1,208.50 Cr (FY2025); indicates co-manufacturing and third-party processing dependencies for FMCG products.
Advertising and sales promotion
Advertising and sales promotion expense ₹1,319.94 Cr (FY2025); essential for brand building, market penetration and competitive positioning across FMCG brands.
Raw materials, packing materials, stores and spares
Total inventory ₹15,061.01 Cr (FY2025) including raw materials ₹10,265.38 Cr; subject to price volatility and availability risk; hedged via commodity futures for select items.

Geographies

1 verified
Nepal (associated company - legal cigarette industry)
Legal cigarette industry contributes to Nepal's GDP via livelihoods in tobacco cultivation, manufacturing and trade; government reforms and industry-friendly policies critical for growth.
Each statement is checked word for word against the FY2025 annual report; the passages are in the app.

What changed recently?

Q1 FY2027 results filed (31 Jul 2026).

Change log

8 entries · newest first
  1. Results filedQ1 FY2027 results filed.
  2. Corporate actionDividend - Rs 8 Per Share.
  3. Results filedQ4 FY2026 results filed.
  4. Corporate actionInterim Dividend - Rs 6.50 Per Share.
  5. Results filedQ3 FY2026 results filed.
  6. Results filedQ2 FY2026 results filed.
  7. Results filedQ1 FY2026 results filed.
  8. Corporate actionDividend - Rs 7.85 Per Share.
Get alerts →Sign in to be told when any of these change.

What this page does not tell you

What could not be judged, and why. Never empty.
  • Models not runFair value, EPV, Graham number, Graham value, Lynch, Owner earnings: no valuation stored.
  • FlagsWATCH on 21 of 30 flags judged; 1 red; 9 could not be judged.
  • ForensicsForensic scores withheld: demerger 2025-01-06.
  • History breakDemerger 2025-01-06 in the 3- and 5-year growth figures: those figures span the accounts before and after it.
  • Data gapsDividend yield, PEG (vendor), Business quality: not available yet.

What this page rests on

✓10 years of annual statements, through FY2026 (Mar-26)✓10 quarters of results✓285 months of month-end prices, adjusted for bonuses and splits (2 corporate actions)○no valuation of ours yet✓business-model card FY2025 · 69 verified

Questions people ask

What is ITC's share price today?

ITC last traded at ₹257.90 on the NSE, as of 12 Oct 2026, 11:00 pm IST, down 3.0% on the day, down 33.4% over a year. Its 52-week range is ₹253 to ₹426. The live price is in the app.

What is ITC's market cap?

ITC's market capitalisation is about ₹3.33 lakh crore: what it would cost to buy every share at today's price. That makes it the 22nd largest large cap company we cover.

Is ITC Ltd a large cap, mid cap or small cap?

ITC Ltd (ITC) is a large cap company in AMFI's classification for Jan-Jun 2026. SEBI's buckets go by rank on six-month average market capitalisation: the top 100 are large caps, 101 to 250 mid caps, the rest small caps.

What is ITC Ltd's P/E ratio?

16.79, vs peers 48.8 · 1st of 9. Price divided by last year's earnings per share: how many years of today's profit you pay for.

Is ITC Ltd overvalued?

Cheap, with low confidence: no valuation within 120 days; P/E 16.8 vs peers 48.8 (1st of 9); P/B 5.2 vs peers 11.5 (1st of 9). Cheap for a reason: A negative 5-year return.

How does ITC Ltd make money?

ITC Limited is a diversified Indian conglomerate with businesses in FMCG (cigarettes, packaged foods, personal care, matches, agarbattis), Paperboards & Specialty Papers, Packaging & Printing, and Agri commodities. It earns revenue through branded consumer products sold via multi-channel distribution (retail, modern trade, e-commerce), paperboard and packaging sales to converters and end-users, and agri-commodity trading and procurement.

Who are ITC Ltd's peers?

Compared with 8 Fast Moving Consumer Goods (the sector, as the industry was too small): Hindustan Unilever Ltd, Nestle India Ltd, Varun Beverages Ltd, Britannia Industries Ltd, Marico Ltd and 3 more. The app shows how they compare on every figure.

Is this investment advice?

No. Valarth is a research and learning tool and is not a SEBI-registered investment adviser or research analyst. The figures come from the company's filings and the exchanges; what to do with them is your call.

How did ITC do last quarter?

ITC reported revenue of ₹19,001 Cr, up 4.7% on a year earlier and a net profit of ₹4,509 Cr, down 40.0% in the Jun 2026 quarter.

Who owns ITC?

ITC has no promoter holding; it is widely held.

Does ITC pay a dividend?

ITC last paid ₹8.00 a share, ex-dividend 27 May 2026; nothing in the past 12 months counts toward a yield.

What do analysts say about ITC?

34 analysts cover ITC, and the consensus is buy. A consensus is a count of opinions, not a forecast; read it beside the numbers.

Everything on ITC, and 6,621 other companies, with 212 filters and the full peer tables