VALARTH See Marico in the appOpen in app
MARICO · NSE · Edible Oil

Marico Ltd

What the numbers mean, from its filings and the exchange. Data as of 12 Oct 2026.
Mid Cap · AMFI list Jan-Jun 2026 · Vendor sector: Consumer Defensive
fair low confidence No valuation within 120 days; P/E 53.9 vs peers 45.3 (10th of 15); P/B 16.5 vs peers 9.9 (11th of 15).
Statements through FY2026Prices adjusted for 2 corporate actionsNot yet reviewed by the adversarial model

What is Marico's share price today?

Marico last traded at ₹782.40 on the NSE, as of 12 Oct 2026, 11:00 pm IST, down 0.5% on the day, up 10.2% over a year. Its 52-week range is ₹704 to ₹889. The live price is in the app.

₹782.40 −0.5% today
+10.2% over 1 year · NSE, as of 12 Oct 2026, 11:00 pm IST
60 month-end closes, 31 Oct 2021 to 30 Sep 2026, adjusted for splits and bonuses
52-week range42% of the way up
Low ₹704High ₹889

What is Marico's market cap?

Marico's market capitalisation is about ₹1.02 lakh crore: what it would cost to buy every share at today's price. That makes it the 13th largest mid cap company we cover.

₹1.0 L Cr Mid Cap13th largest mid cap company
Mid Cap means the companies ranked 101 to 250 by size, under SEBI's rules. Shares in issue are worked out from the market cap and the price. What market cap tells you →

Key facts

From the exchange
Symbol
NSE: MARICO
ISIN
INE196A01026
Cap bucket
Mid Cap, 13th largest by market cap
Industry (NSE)
Fast Moving Consumer Goods › Agricultural Food & other Products › Edible Oil
Listed since
1996
Futures and options
Traded

Is Marico overvalued?

Fair, with low confidence: no valuation within 120 days; P/E 53.9 vs peers 45.3 (10th of 15); P/B 16.5 vs peers 9.9 (11th of 15).

Valuation

Latest price and trailing 12 months
P/E 53.88
vs peers 45.3 · 10th of 15
Price divided by last year's earnings per share: how many years of today's profit you pay for. Learn more →
P/B 16.48
vs peers 9.9 · 11th of 15
Price divided by book value per share: what you pay for each rupee of net assets on the balance sheet. Learn more →
Market cap ₹1.02 lakh Cr
Total market value of all shares, in ₹ crore. Learn more →
Dividend yield 0.5%
vs peers 1.0% · 10th of 12
Last year's dividends as a share of today's price. Learn more →
PEG (vendor) 31.70
vs peers 9.9 · 9th of 10
P/E divided by the vendor's earnings growth figure, which it does not disclose; a P/E adjusted for how fast profits grow. Learn more →
PEG on our 3-year EPS growth 5.13
P/E divided by the 3-year EPS growth rate from the stored accounts. Learn more →
3 models could be judged
Skipped — Fair value, EPV, Graham number, Graham value, Lynch, Owner earnings: no valuation stored

Our valuation range

🔒 Pro
Value range, implied growth at today's price, and the nine models behind it: in the app.

Is Marico a quality business?

Quality score 65.2, 4th of 15 in its peer set; WATCH on 30 of 30 flags judged.

Quality and risk

Data as of 12 Oct 2026
Business quality Not available
The kind of business, which sets the yardstick it is judged by. Learn more →
Quality score 65.2
vs peers 46.0 · 4th of 15
Returns, margins, leverage and consistency against its peers, out of 100. Learn more →
Risk level WATCH
30 of 30 flags judged
From flags on debt, earnings quality, dilution and price swings. Learn more →

Profitability

ROE 37.0%
vs peers 21.2% · 4th of 15
Return on equity: profit as a share of shareholders' money. Learn more →
ROCE 41.7%
vs peers 26.6% · 4th of 15
Return on capital employed: operating profit as a share of all the capital in the business, debt and equity. Learn more →
Profit margin 13.0%
vs peers 13.9% · 10th of 15
Profit after everything, as a share of revenue. Learn more →
EPS ₹13.95
Trailing 12 months
Profit for each share over the last 12 months.

Scorecard

🔒 Pro
Health scores and red flags with their values and history: in the app.
Inside the app

Get a sneak peek of Valarth

Start freeStart free
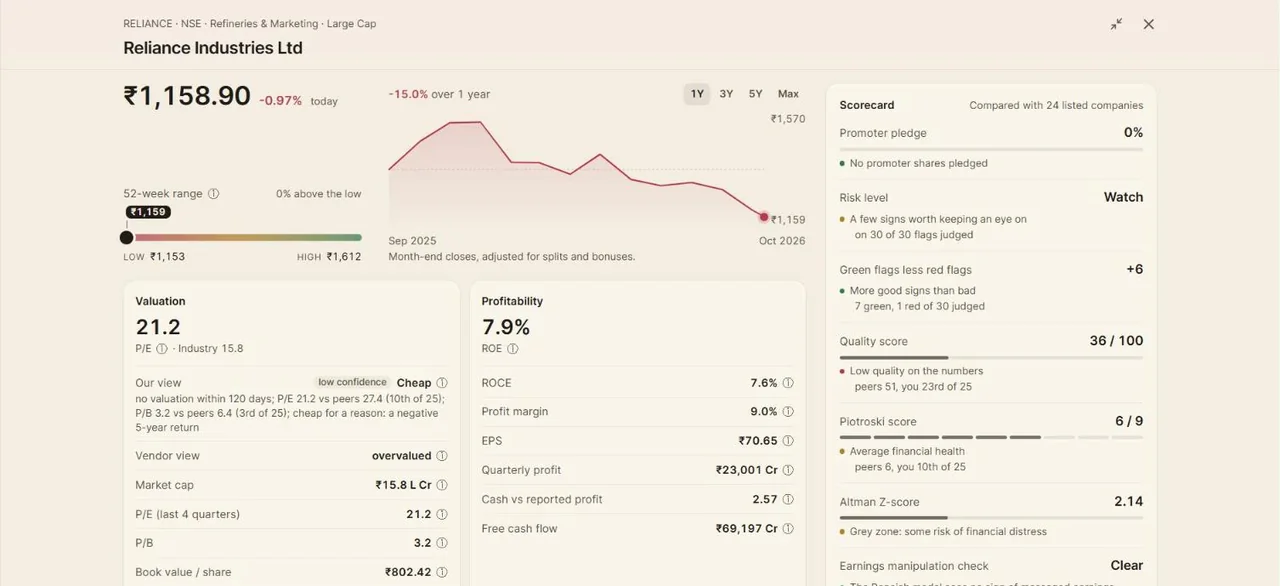
A Valarth stock page: the share price with its chart and 52-week range, valuation and profitability figures, and a scorecard of health checks.
Stock pagePrice, valuation, profitability and a scorecard of health checks for every company, each figure explained.
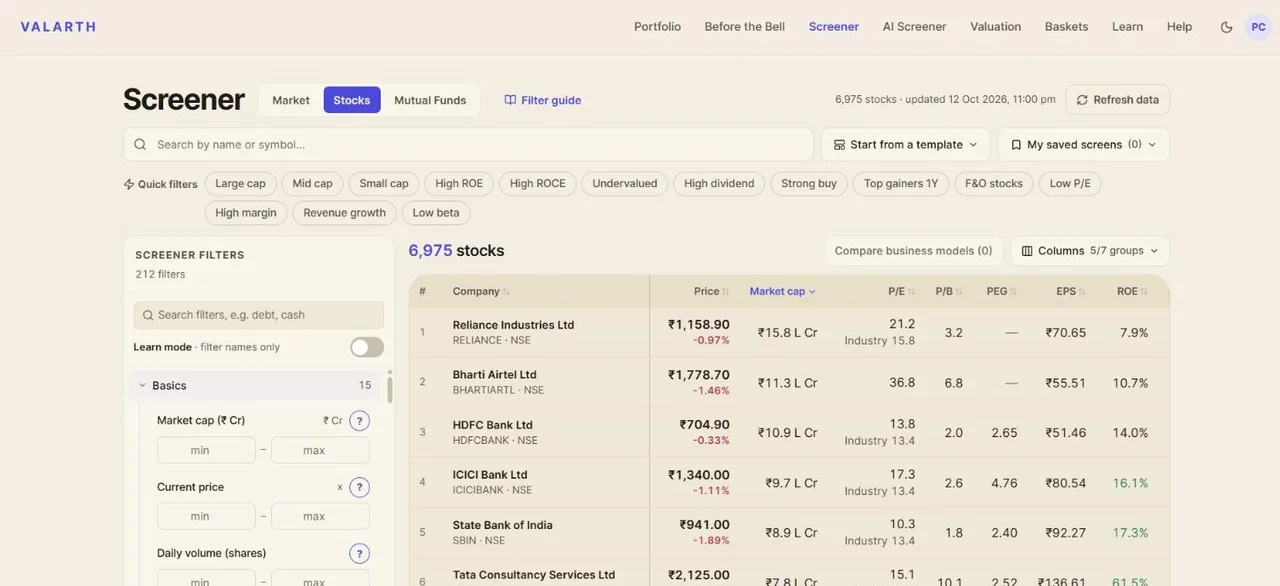
The Valarth stock screener: a table of companies with price, market cap, P/E, P/B, PEG, EPS and ROE, and filters down the left.
ScreenerEvery listed company, filtered on 212 figures, each with a plain-language lesson beside it.
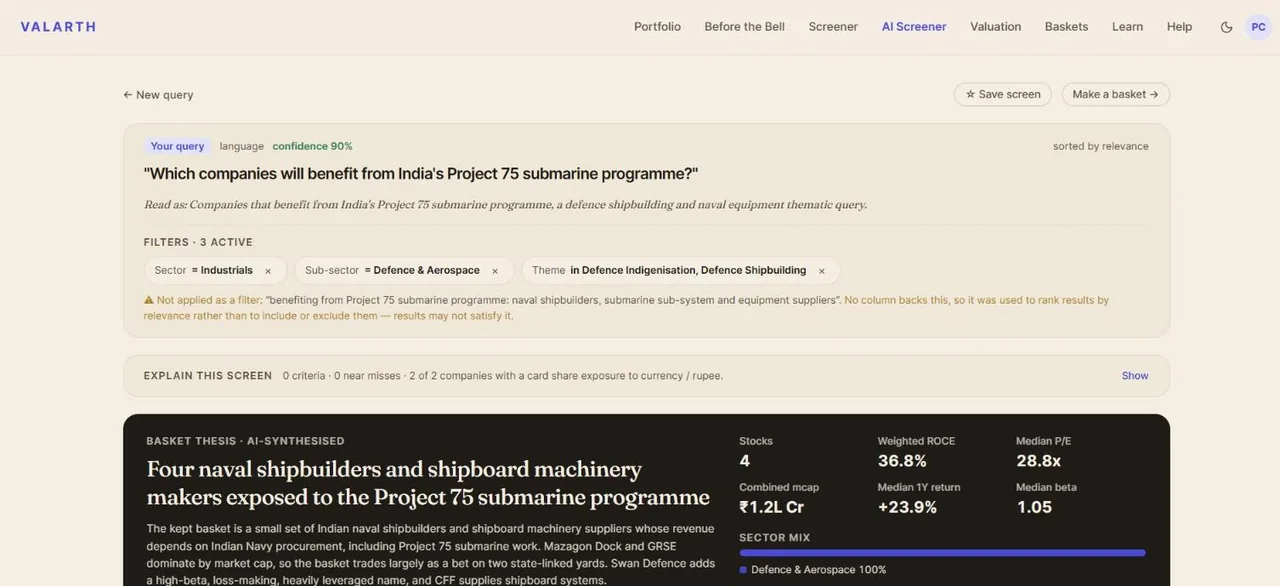
The Valarth AI Screener answering 'Which companies will benefit from India's Project 75 submarine programme?' with a basket of four naval shipbuilders and a written thesis.
AI ScreenerAsk a question in plain English, like which companies benefit from India's Project 75. It reads the intent, builds the screen and writes the thesis.
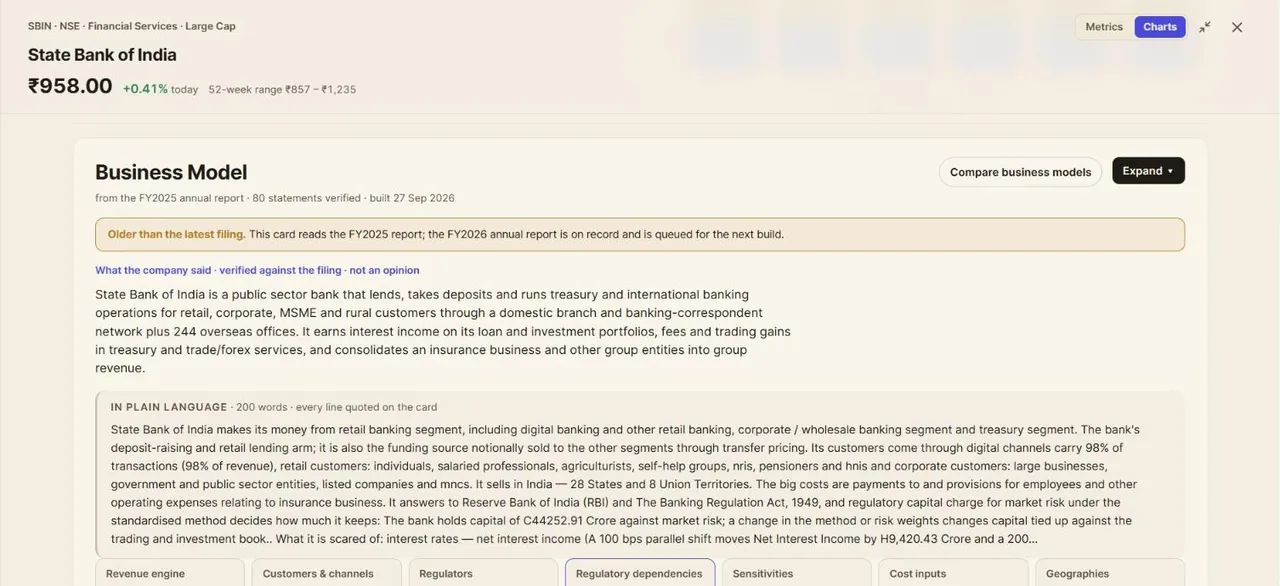
A Valarth business-model card for State Bank of India, with a plain-language summary and statements verified against the filing.
Business modelHow a company makes money and what can hurt it, each statement checked against its annual report.
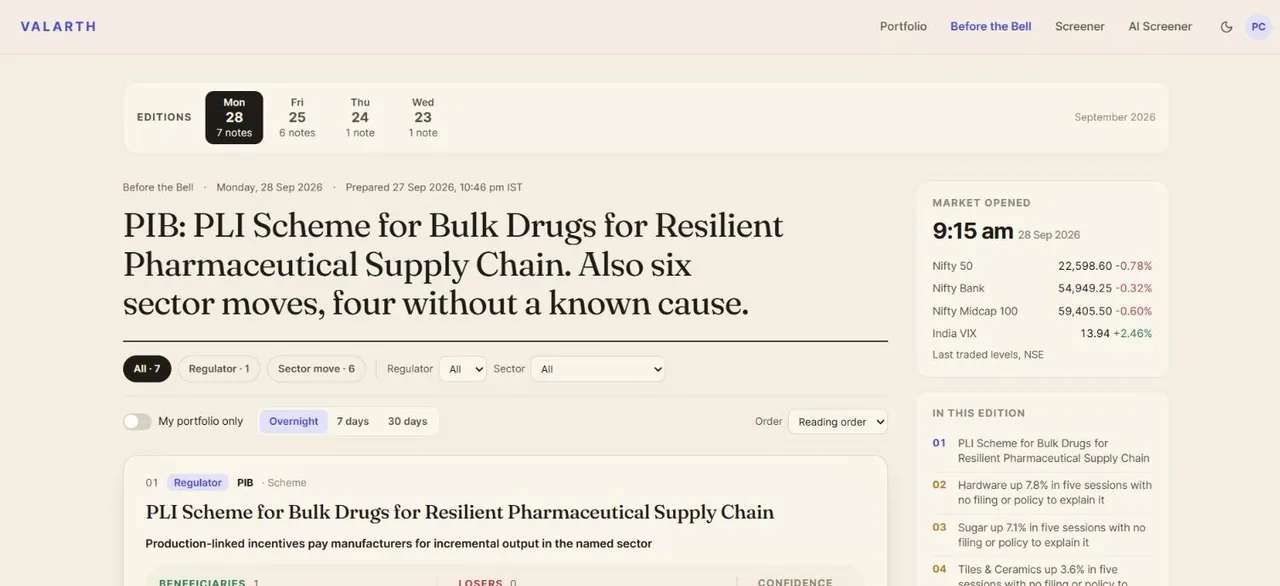
Valarth's Before the Bell edition, with the day's headline, regulator notes and sector moves.
Before the BellA morning edition before the market opens: what moved, which rule changed, and what it means for your holdings.

Has Marico made money for shareholders?

Yes: +10.2% over one year and +7.5% a year over five years.

Shareholder returns

1-year return +10.2%
Price only
What the share price did over the last 12 months. Learn more →
5-year return +7.5% a year
Price only
Yearly average price return over five years, bonuses and splits adjusted. Learn more →
Wealth destroyer No
Five-year total return — price CAGR on bonus- and split-adjusted closes plus the dividend yield — below the 7% a bank fixed deposit paid. Learn more →

Returns

3Y and 5Y are yearly averages
1W
−0.5%
1M
−0.6%
3M
−7.2%
6M
+4.4%
1Y
+10.2%
3Y
+13.6%
5Y
+7.5%

Does Marico pay a dividend?

Yes. Marico's dividend yield is 0.54% at the latest price; the last payout was ₹4.00 a share, ex-dividend 30 Jul 2026.

Dividends

Per share, by ex-dividend date
Dividend yield0.54%
The past 12 months' dividends as a share of today's price.
30 Jul 2026 · Final₹4.00
1 Aug 2025 · Final₹7.00
7 Feb 2025 · Interim₹3.50
6 Mar 2024 · Interim 2₹6.50
7 Nov 2023 · Interim₹3.00
Payout ratio🔒 In the app
The share of profit paid out as dividends; a very high share leaves little to reinvest.
Dividend growth, 5 years🔒 In the app
How fast the dividend per share has grown a year.
Years without a miss🔒 In the app
How many years in a row a dividend has been paid.

Is Marico growing?

Revenue 3 years 12.3% a year; profit 3 years 10.6% a year; revenue 5 years 6.3% a year.

Growth

Statements through FY2026 (Mar-26)
Revenue 3 years 12.3% a year
vs peers 7.5% · 5th of 13
Compound annual growth of revenue over three years. Learn more →
Profit 3 years 10.6% a year
vs peers 8.4% · 6th of 13
Compound annual growth of net profit over three years. Learn more →
Revenue 5 years 6.3% a year
Compound annual growth of revenue over five years. Learn more →
Profit 5 years 9.0% a year
Compound annual growth of net profit over five years. Learn more →
EPS 3 years 10.5% a year
Growth in earnings per share, so dilution counts against the company. Learn more →
EPS 5 years 8.4% a year
Growth in earnings per share over five years, so dilution counts against the company. Learn more →
P/E vs own history 3.2%
vs peers -19.8% · 11th of 12
Today's P/E against its own 5-year median; negative is cheaper than its history. Learn more →

How did Marico do last quarter?

Marico reported revenue of ₹3,957 Cr, up 24.5% on a year earlier and a net profit of ₹652 Cr, up 9.3% in the Jun 2026 quarter.

Latest quarter

Jun 2026
Revenue, latest quarter₹3,957 Cr
+24.5% on a year earlier
What the company took in over the quarter.
Net profit, latest quarter₹652 Cr
+9.3% on a year earlier
What was left for shareholders after every cost and tax.

How does Marico compare with its peers?

Compared with 14 Fast Moving Consumer Goods (the sector, as the industry was too small); 10th of 15 on P/E; 4th of 15 on quality score.

Compared with 14 Fast Moving Consumer Goods (the sector, as the industry was too small)

14 companies

Marico against its peers

Largest 10 of 14 peers, by market cap
CompanyMarket capP/EP/BROEROCE1YQuality 🔒Rank 🔒
Marico Ltd₹1.0 L Cr53.916.537.0%41.7%+10.2%
ITC Ltd₹3.3 L Cr16.85.229.4%38.0%−33.4%
Nestle India Ltd₹2.6 L Cr67.442.775.2%56.1%+12.2%
Varun Beverages Ltd₹1.5 L Cr44.18.815.2%19.4%−0.3%
Britannia Industries Ltd₹1.2 L Cr44.628.260.1%60.6%−17.7%
United Spirits Ltd₹99,356 Cr51.510.122.1%28.5%+3.8%
Tata Consumer Products Ltd₹94,516 Cr57.85.69.4%11.7%−14.5%
Godrej Consumer Products Ltd₹88,055 Cr46.012.818.7%20.2%−22.5%
Dabur India Ltd₹68,599 Cr34.89.719.9%24.7%−20.7%
Radico Khaitan Ltd₹60,965 Cr86.610.820.3%24.0%+51.8%
Colgate-Palmolive (India) Ltd₹49,442 Cr36.730.781.6%104.1%−18.2%
Peer median—45.39.921.2%26.6%−17.9%
Market cap in rupees crore; P/E and P/B on the latest price; 1Y is the price return over a year. A dash is a figure that does not apply or is not reported.

Full peer comparison

🔒 Pro
Every peer, every figure, the ranks and the quality and forensic scores side by side: in the app.

Who owns Marico?

Marico is held by promoters 58.9%, foreign institutions 23.4%, domestic institutions 13.0%.

Shareholding pattern

Latest filing, percent of shares
Promoters58.9%
The founders and controlling group.
Foreign institutions23.4%
Overseas funds investing through the FPI route.
Domestic institutions13.0%
Indian insurers, banks, pension and mutual funds together.
Mutual funds8.4%
Indian mutual fund schemes; part of domestic institutions.
Retail and others3.2%
Individual investors and everyone else.
Promoter shares pledged🔒 In the app
Promoter shares given as collateral for loans; a high share is a risk to watch.
Holding trend🔒 In the app
Whether promoters, foreign funds and mutual funds have been adding or selling over recent quarters.

What do analysts say about Marico?

38 analysts cover Marico, and the consensus is buy. A consensus is a count of opinions, not a forecast; read it beside the numbers.

Analyst consensus

38 analysts
ConsensusBuy
The rating most covering analysts give the share.
Average target price🔒 In the app
The mean of the analysts' 12-month price targets.
Upside to target🔒 In the app
How far the target sits above or below today's price.
Share rating it a buy🔒 In the app
The share of covering analysts with a buy rating.

What does Marico do and what is it sensitive to?

Marico Limited manufactures and sells FMCG products including coconut oil, edible oils, hair oils, hair care, personal care, and fabric care products across India and international markets (Bangladesh, Vietnam, Middle East, Egypt, South Africa). Sensitive to: commodity Price Volatility (Agricultural Commodities, Edible Oils, Crude Oil).

Business-model card

FY2025 · 64 verified
4Revenue
4Channels
3Regulators
4Reg. dependencies
6Sensitivities
7Costs
6Geographies

Marico Limited manufactures and sells FMCG products including coconut oil, edible oils, hair oils, hair care, personal care, and fabric care products across India and international markets (Bangladesh, Vietnam, Middle East, Egypt, South Africa). It earns revenue through direct sales to consumers via modern trade, e-commerce, and traditional distribution channels, plus international operations representing 25% of consolidated revenues.

Revenue by segment

year ended 31st March, 2025
India74.9%
International25.1%

Revenue engine

4 verified
India Consumer Products Business (75.0%)
Comprises domestic sales of coconut oil, premium refined edible oils, value-added hair oils, anti-lice treatments, fabric care, functional and processed foods, hair creams and gels, hair serums, shampoos, shower gels, hair relaxers and straighteners, deodorants and similar consumer products, by-products and scrap sales.
International Business (Bangladesh, Vietnam, Middle East, Egypt, South Africa) (25.0%)
International business recorded turnover of ₹2,721 Crores in FY25, registering 8% growth in INR terms and 14% constant currency growth. Operating margin improved to 27.9% in FY25 from 26.8% prior year.
South Africa Business (~9% of International Business)
South Africa business delivered constant currency growth of 19% in FY25, led by strong performance in Health Care and Hair Care segments.
1 more statement
New Country Development & Exports (~9% of International Business)
Segment grew 16% in FY25. Company continues to remain optimistic about long-term prospects as it incubates new geographies to broaden global footprint.

Customers & channels

4 verified
Modern Trade Channel
Modern Trade delivered strong performance across key categories, driven by deep partnerships with channel partners and focus on in-store execution excellence. Backend technology interventions like AI-powered order processing and control tower mechanisms boosted fill rates and improved on-shelf availability.
E-Commerce Channel
E-Commerce posted double-digit growth, led by healthy performance in priority categories and tremendous scale of Quick Commerce sub-channel. Growth powered by distribution expansion across e-grocers, category activations in personal care, and pack innovations.
Quick-Commerce Channel
Over two-thirds of all online grocery orders and nearly 10% of total e-retail spending in 2024 occurred via Quick-Commerce platforms. These platforms now include personal care, medicines, drinks, and snacks. Bain & Company expects growth over 40% annually through 2030.
1 more statement
Traditional Kirana and Offline Channels
Many traditional kiranas are upgrading storefronts, adopting digital payments, and ordering directly from FMCG brands. This blurring of offline and online models expands product availability, enhances convenience, and enables better coverage through platform partnerships.

Regulators

3 verified
SEBI (Securities and Exchange Board of India)
Governs listing regulations, insider trading, share-based employee benefits, and mandates Business Responsibility and Sustainability Report (BRSR) requirements for disclosure of ESG and sustainability metrics.
Ministry of Corporate Affairs / Companies Act
Governs Related Party Transactions policy, audit committee functions, internal financial controls, and corporate governance frameworks adopted by the company.
Food Safety and Packaging Regulators (National and International)
Regulations on product safety, ingredients, chemicals, and plastic packaging are evolving. Marico must align with new rules at national level and industry benchmarks at global level.

Regulatory dependencies

4 verified
Plastic Packaging and Extended Producer Responsibility (EPR) Compliance
Regulatory compliance on packaging waste and EPR requirements impacts cost competitiveness and brand image. Company must develop sustainable packaging solutions and explore circular economy approaches.
Product Safety and Ingredient Regulations
Emerging rules and regulations on product safety, ingredients and chemicals require continuous monitoring and adaptation to remain compliant at national and international levels.
Carbon Pricing and Climate Regulation Exposure
Climate change adaptation, mitigation and carbon pricing create transition risk from carbon regulation, but also enable brand differentiation through sustainable practices.
1 more statement
SEBI Business Responsibility and Sustainability Report (BRSR) Mandate
Mandatory publication of BRSR with independent reasonable assurance report on ESG and sustainability metrics affects disclosure requirements and governance mechanisms.

Sensitivities

6 verified
Commodity Price Volatility (Agricultural Commodities, Edible Oils, Crude Oil)
Unexpected changes in commodity prices and supply could impact business margins and ability to service demand. Past few years witnessed wide fluctuations in input prices, creating considerable uncertainty.
Foreign Currency Exchange Rate Fluctuations
Marico has significant local presence in Bangladesh, South East Asia, Middle East, Egypt and South Africa, exposing it to multiple currencies. Currency depreciation risk is accentuated during periods of high inflation in these economies.
Interest Rate Volatility
Changes in interest regime and borrowing terms could impact financial performance. Though FMCG sector is not capital intensive, fund requirements arise from inventory building, capital expenditure, and inorganic growth funding.
3 more statements
Rural Consumption and Monsoon-Dependent Agricultural Growth
Robust rural consumption is driven by agricultural growth aided by strong monsoon season. With healthy kharif harvests and improved rabi sowing, rural consumption expected to remain strong, further boosted by festive season spending.
Macroeconomic Factors and Food Inflation
Factors such as low GDP growth and high food inflation could result in down trading from branded to non-branded or premium to mass market products.
USD/INR Exchange Rate Sensitivity
INR/USD increase by 6% results in -₹9 crore impact on profit after tax; INR/USD decrease by 6% results in +₹9 crore impact (as of 31 March 2025).

Cost inputs

7 verified
Raw Materials (Agricultural Commodities and Edible Oils)
Total raw materials consumed ₹4,025 crore in FY25 (₹3,397 crore in FY24). Comprises coconut oil, edible oils, and other agricultural commodities subject to price volatility.
Packing Materials
Total packing materials consumed ₹547 crore in FY25 (₹544 crore in FY24). Subject to plastic packaging regulations and sustainability compliance requirements.
Employee Benefit Expense
Total employee benefit expense ₹831 crore in FY25 (₹743 crore in FY24), including salaries, wages, bonus, provident fund contribution, share-based payments, and staff welfare.
4 more statements
Manufacturing and Processing Charges
Manufacturing charges ₹225 crore in FY25 (₹200 crore in FY24). Includes processing and other manufacturing charges for converting raw materials into finished products.
Depreciation and Amortization Expense
Total depreciation and amortization expense ₹178 crore in FY25 (₹158 crore in FY24), comprising depreciation on property, plant and equipment, investment properties, intangible assets and ROU assets.
Rent and Storage Charges
Rent and storage charges ₹25 crore in FY25 (₹19 crore in FY24) for distribution and warehouse operations.
Legal & Professional Charges
Legal and professional charges ₹69 crore in FY25 (₹59 crore in FY24).

Geographies

6 verified
India (Domestic Market) (75.0%)
Comprises 75% of consolidated revenues. Manufacturing facilities in Sonipat, Coimbatore, Hyderabad, Kolkata, Bhiwandi, Guwahati. Redistribution centers and depots across 24 locations nationwide. Regional offices in New Delhi, Kolkata, Mumbai, and Hyderabad.
Bangladesh
Significant local presence with manufacturing and distribution operations. Part of International Business segment. Subsidiary Marico Bangladesh Limited operates with subsidiary-level governance.
Vietnam
International market with manufacturing facility. Non-current assets (including ₹642 crore goodwill) of ₹776 crore as at 31 March 2025. Key market for distribution-led growth.
3 more statements
Middle East and North Africa (Egypt, MENA Region)
International operations with Herbs India brand tailored to regional preferences. Marico Middle East FZE operates in this region. Egypt is a key market with corporate guarantees of ₹568 crore.
South Africa
South Africa (~9% of International Business) delivered constant currency growth of 19% in FY25. Non-current assets of ₹59 crore as at 31 March 2025. Part of accelerated scale-up in regional operations.
Global Footprint
8 International Manufacturing Facilities, 23 International Offices, and presence across multiple regions: Middle East, North Africa, South East Asia, South Asia, and Sub-Saharan Africa.
Each statement is checked word for word against the FY2025 annual report; the passages are in the app.

What changed recently?

Q1 FY2027 results filed (4 Aug 2026).

Change log

8 entries · newest first
  1. Results filedQ1 FY2027 results filed.
  2. Corporate actionDividend - Rs 4 Per Share.
  3. Results filedQ4 FY2026 results filed.
  4. Results filedQ4 FY2025 results filed.
  5. Results filedQ3 FY2026 results filed.
  6. Results filedQ2 FY2026 results filed.
  7. Results filedQ1 FY2026 results filed.
  8. Corporate actionDividend - Rs 7 Per Share.
Get alerts →Sign in to be told when any of these change.

What this page does not tell you

What could not be judged, and why. Never empty.
  • Models not runFair value, EPV, Graham number, Graham value, Lynch, Owner earnings: no valuation stored.
  • FlagsWATCH on 30 of 30 flags judged; 1 red.
  • Data gapsBusiness quality: not available yet.

What this page rests on

✓10 years of annual statements, through FY2026 (Mar-26)✓10 quarters of results✓256 months of month-end prices, adjusted for bonuses and splits (2 corporate actions)○no valuation of ours yet✓business-model card FY2025 · 64 verified

Questions people ask

What is Marico's share price today?

Marico last traded at ₹782.40 on the NSE, as of 12 Oct 2026, 11:00 pm IST, down 0.5% on the day, up 10.2% over a year. Its 52-week range is ₹704 to ₹889. The live price is in the app.

What is Marico's market cap?

Marico's market capitalisation is about ₹1.02 lakh crore: what it would cost to buy every share at today's price. That makes it the 13th largest mid cap company we cover.

Is Marico Ltd a large cap, mid cap or small cap?

Marico Ltd (MARICO) is a mid cap company in AMFI's classification for Jan-Jun 2026. SEBI's buckets go by rank on six-month average market capitalisation: the top 100 are large caps, 101 to 250 mid caps, the rest small caps.

What is Marico Ltd's P/E ratio?

53.88, vs peers 45.3 · 10th of 15. Price divided by last year's earnings per share: how many years of today's profit you pay for.

Is Marico Ltd overvalued?

Fair, with low confidence: no valuation within 120 days; P/E 53.9 vs peers 45.3 (10th of 15); P/B 16.5 vs peers 9.9 (11th of 15).

How does Marico Ltd make money?

Marico Limited manufactures and sells FMCG products including coconut oil, edible oils, hair oils, hair care, personal care, and fabric care products across India and international markets (Bangladesh, Vietnam, Middle East, Egypt, South Africa). It earns revenue through direct sales to consumers via modern trade, e-commerce, and traditional distribution channels, plus international operations representing 25% of consolidated revenues.

Who are Marico Ltd's peers?

Compared with 14 Fast Moving Consumer Goods (the sector, as the industry was too small): ITC Ltd, Nestle India Ltd, Varun Beverages Ltd, Britannia Industries Ltd, United Spirits Ltd and 9 more. The app shows how they compare on every figure.

Is this investment advice?

No. Valarth is a research and learning tool and is not a SEBI-registered investment adviser or research analyst. The figures come from the company's filings and the exchanges; what to do with them is your call.

How did Marico do last quarter?

Marico reported revenue of ₹3,957 Cr, up 24.5% on a year earlier and a net profit of ₹652 Cr, up 9.3% in the Jun 2026 quarter.

Who owns Marico?

Marico is held by promoters 58.9%, foreign institutions 23.4%, domestic institutions 13.0%.

Does Marico pay a dividend?

Yes. Marico's dividend yield is 0.54% at the latest price; the last payout was ₹4.00 a share, ex-dividend 30 Jul 2026.

What do analysts say about Marico?

38 analysts cover Marico, and the consensus is buy. A consensus is a count of opinions, not a forecast; read it beside the numbers.

Everything on Marico, and 6,621 other companies, with 212 filters and the full peer tables