VALARTH See Sagility in the appOpen in app
SAGILITY · NSE · IT Enabled Services

Sagility Ltd

What the numbers mean, from its filings and the exchange. Data as of 13 Oct 2026.
Small Cap · AMFI list Jan-Jun 2026 · Vendor sector: IT - Software
cheap low confidence No valuation within 120 days; P/E 20.8 vs peers 46.9 (1st of 9); P/B 1.8 vs peers 9.8 (1st of 10).
Statements through FY2026Prices adjusted for corporate actionsNot yet reviewed by the adversarial model

What is Sagility's share price today?

Sagility last traded at ₹43.28 on the NSE, as of 13 Oct 2026, 9:45 am IST, up 0.2% on the day, down 6.6% over a year. Its 52-week range is ₹36 to ₹58. The live price is in the app.

₹43.28 +0.2% today
−6.6% over 1 year · NSE, as of 13 Oct 2026, 9:45 am IST
21 month-end closes, 30 Nov 2024 to 30 Sep 2026, adjusted for splits and bonuses
52-week range34% of the way up
Low ₹36High ₹58

What is Sagility's market cap?

Sagility's market capitalisation is about ₹20,219 crore: what it would cost to buy every share at today's price. That makes it the 122nd largest small cap company we cover.

₹20,219 Cr Small Cap122nd largest small cap company
Small Cap means the companies ranked 251 and below by size, under SEBI's rules. Shares in issue are worked out from the market cap and the price. What market cap tells you →

Key facts

From the exchange
Symbol
NSE: SAGILITY
ISIN
INE0W2G01015
Cap bucket
Small Cap, 122nd largest by market cap
Industry (NSE)
Information Technology › IT - Services › IT Enabled Services
Listed since
2024
Futures and options
Traded

Is Sagility overvalued?

Cheap, with low confidence: no valuation within 120 days; P/E 20.8 vs peers 46.9 (1st of 9); P/B 1.8 vs peers 9.8 (1st of 10).

Valuation

Latest price and trailing 12 months
P/E 20.75
vs peers 46.9 · 1st of 9
Price divided by last year's earnings per share: how many years of today's profit you pay for. Learn more →
P/B 1.79
vs peers 9.8 · 1st of 10
Price divided by book value per share: what you pay for each rupee of net assets on the balance sheet. Learn more →
Market cap ₹20,219 Cr
Total market value of all shares, in ₹ crore. Learn more →
Dividend yield Not available
Last year's dividends as a share of today's price. Learn more →
PEG (vendor) 29.65
vs peers 5.6 · 6th of 6
P/E divided by the vendor's earnings growth figure, which it does not disclose; a P/E adjusted for how fast profits grow. Learn more →
PEG on our 3-year EPS growth 0.54
P/E divided by the 3-year EPS growth rate from the stored accounts. Learn more →
2 models could be judged
Skipped — Fair value, EPV, Graham number, Graham value, Lynch, Owner earnings: no valuation stored; P/E vs own history: 0 of 36 months of P/E history

Our valuation range

🔒 Pro
Value range, implied growth at today's price, and the nine models behind it: in the app.

Is Sagility a quality business?

Quality score 58, 4th of 11 in its peer set; CAUTION on 26 of 30 flags judged.

Quality and risk

Data as of 13 Oct 2026
Business quality Not available
The kind of business, which sets the yardstick it is judged by. Learn more →
Quality score 58
vs peers 52.5 · 4th of 11
Returns, margins, leverage and consistency against its peers, out of 100. Learn more →
Risk level CAUTION
26 of 30 flags judged
From flags on debt, earnings quality, dilution and price swings. Learn more →

Profitability

ROE 3.4%
vs peers 12.8% · 9th of 11
Return on equity: profit as a share of shareholders' money. Learn more →
ROCE 4.7%
vs peers 18.2% · 8th of 11
Return on capital employed: operating profit as a share of all the capital in the business, debt and equity. Learn more →
Profit margin 12.9%
vs peers 9.3% · 3rd of 9
Profit after everything, as a share of revenue. Learn more →
EPS ₹1.98
Trailing 12 months
Profit for each share over the last 12 months.

Scorecard

🔒 Pro
Health scores and red flags with their values and history: in the app.
Inside the app

Get a sneak peek of Valarth

Start freeStart free
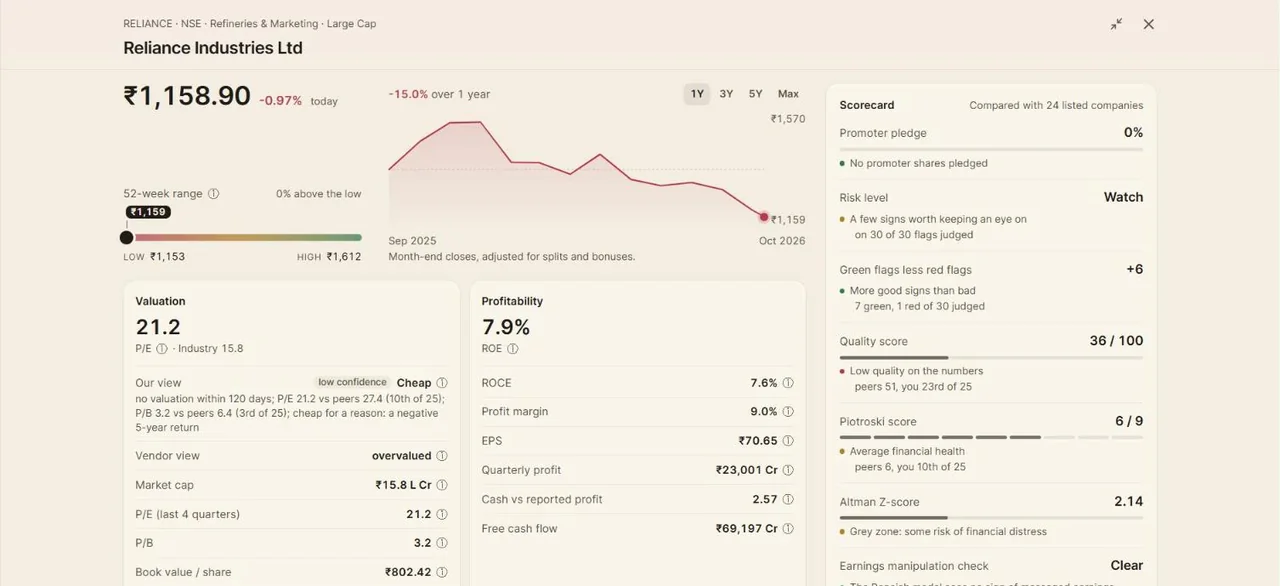
A Valarth stock page: the share price with its chart and 52-week range, valuation and profitability figures, and a scorecard of health checks.
Stock pagePrice, valuation, profitability and a scorecard of health checks for every company, each figure explained.
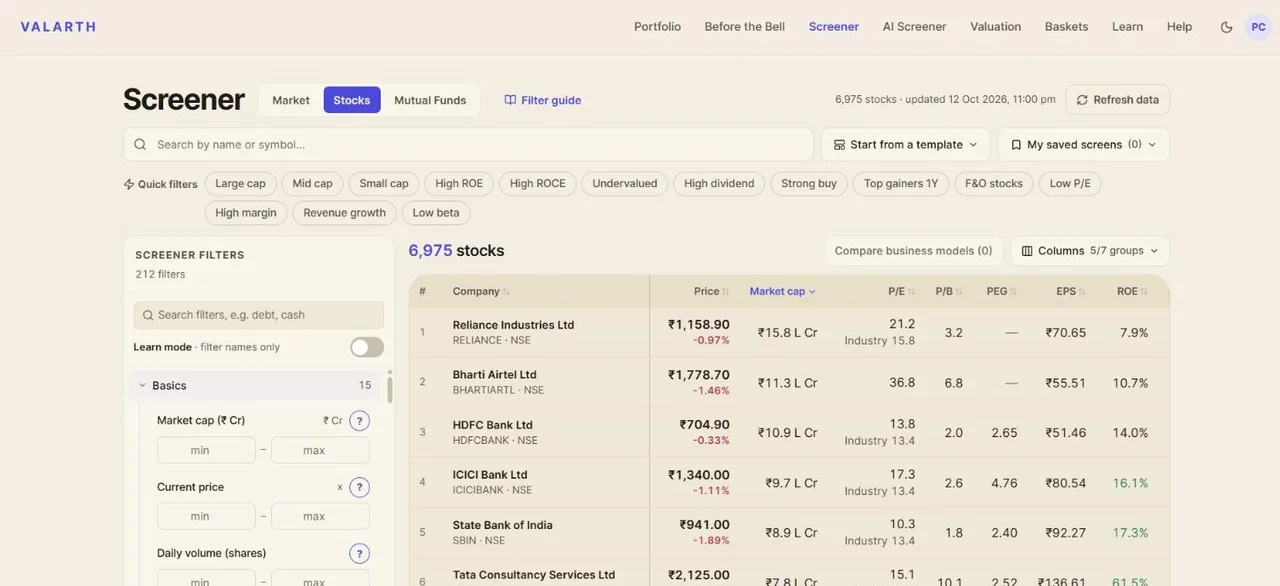
The Valarth stock screener: a table of companies with price, market cap, P/E, P/B, PEG, EPS and ROE, and filters down the left.
ScreenerEvery listed company, filtered on 212 figures, each with a plain-language lesson beside it.
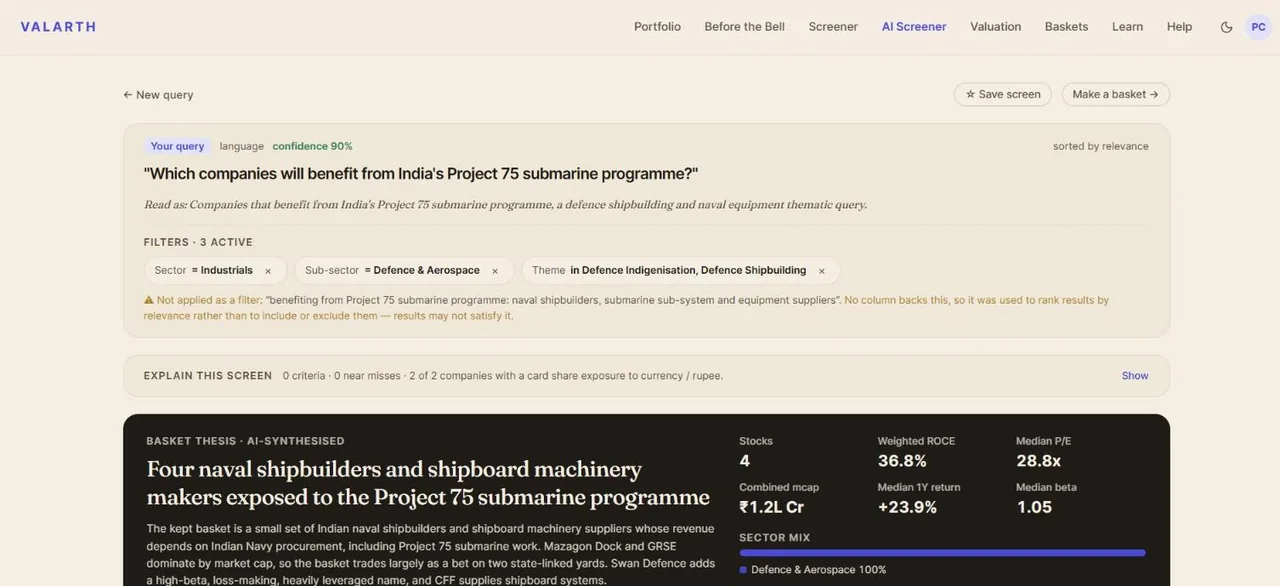
The Valarth AI Screener answering 'Which companies will benefit from India's Project 75 submarine programme?' with a basket of four naval shipbuilders and a written thesis.
AI ScreenerAsk a question in plain English, like which companies benefit from India's Project 75. It reads the intent, builds the screen and writes the thesis.
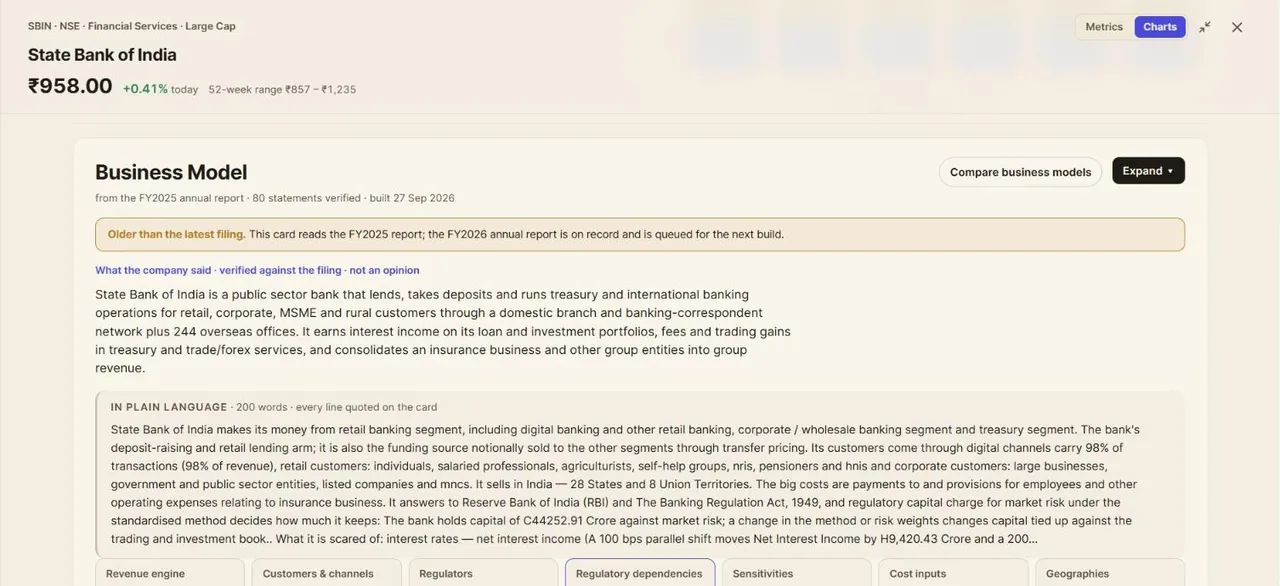
A Valarth business-model card for State Bank of India, with a plain-language summary and statements verified against the filing.
Business modelHow a company makes money and what can hurt it, each statement checked against its annual report.
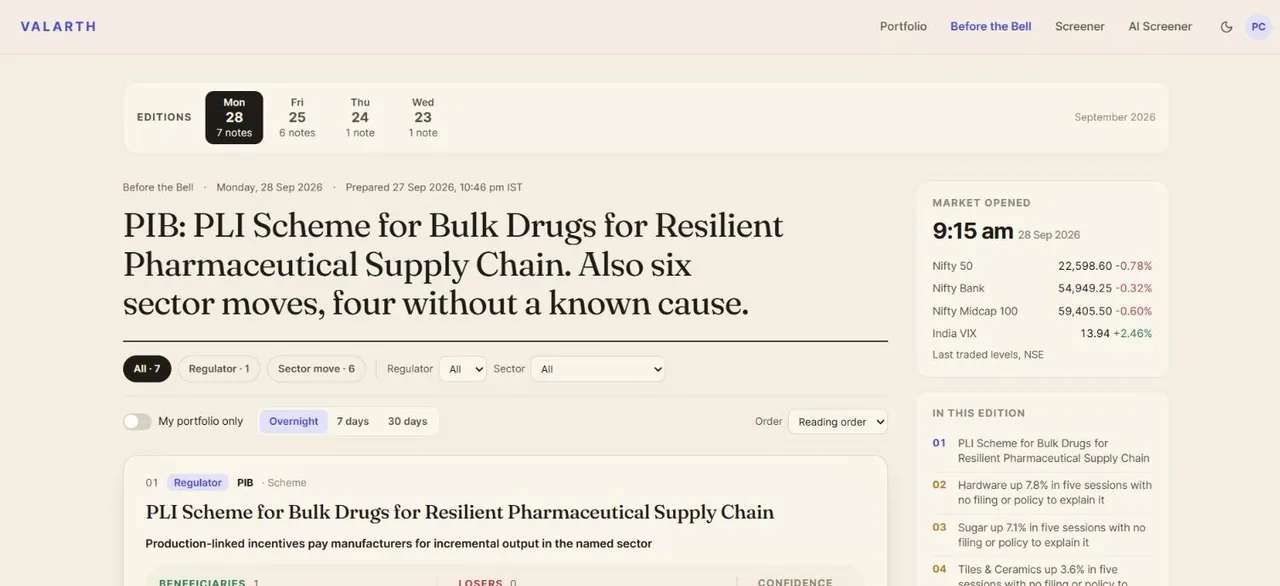
Valarth's Before the Bell edition, with the day's headline, regulator notes and sector moves.
Before the BellA morning edition before the market opens: what moved, which rule changed, and what it means for your holdings.

Has Sagility made money for shareholders?

Not over these periods: −6.6% over one year.

Shareholder returns

1-year return −6.6%
Price only
What the share price did over the last 12 months. Learn more →
5-year return Not available
Yearly average price return over five years, bonuses and splits adjusted. Learn more →
Wealth destroyer Not available
Five-year total return — price CAGR on bonus- and split-adjusted closes plus the dividend yield — below the 7% a bank fixed deposit paid. Learn more →

Returns

3Y and 5Y are yearly averages
1W
−1.6%
1M
−5.3%
3M
+2.8%
6M
+2.9%
1Y
−6.6%
3Y
—
5Y
—
— not available

Does Sagility pay a dividend?

Sagility last paid ₹0.10 a share, ex-dividend 7 Aug 2026; nothing in the past 12 months counts toward a yield.

Dividends

Per share, by ex-dividend date
7 Aug 2026 · Final₹0.10
12 Nov 2025 · Interim₹0.05
Payout ratio🔒 In the app
The share of profit paid out as dividends; a very high share leaves little to reinvest.
Dividend growth, 5 years🔒 In the app
How fast the dividend per share has grown a year.
Years without a miss🔒 In the app
How many years in a row a dividend has been paid.

Is Sagility growing?

Revenue 3 years 19.8% a year; profit 3 years 86.1% a year; revenue 5 years 52.2% a year.

Growth

Statements through FY2026 (Mar-26)
Revenue 3 years 19.8% a year
vs peers 26.3% · 7th of 11
Compound annual growth of revenue over three years. Learn more →
Profit 3 years 86.1% a year
vs peers 23.0% · 2nd of 8
Compound annual growth of net profit over three years. Learn more →
Revenue 5 years 52.2% a year
Compound annual growth of revenue over five years. Learn more →
Profit 5 years Not available
Compound annual growth of net profit over five years. Learn more →
EPS 3 years 38.3% a year
Growth in earnings per share, so dilution counts against the company. Learn more →
EPS 5 years Not available
Growth in earnings per share over five years, so dilution counts against the company. Learn more →
P/E vs own history Not available
Today's P/E against its own 5-year median; negative is cheaper than its history. Learn more →

How did Sagility do last quarter?

Sagility reported revenue of ₹1,963 Cr, up 29.1% on a year earlier and a net profit of ₹217 Cr, up 71.5% in the Jun 2026 quarter.

Latest quarter

Jun 2026
Revenue, latest quarter₹1,963 Cr
+29.1% on a year earlier
What the company took in over the quarter.
Net profit, latest quarter₹217 Cr
+71.5% on a year earlier
What was left for shareholders after every cost and tax.

How does Sagility compare with its peers?

Compared with 10 IT Enabled Services; 1st of 9 on P/E; 4th of 11 on quality score.

Compared with 10 IT Enabled Services

10 companies

Sagility against its peers

Largest 10 of 10 peers, by market cap
CompanyMarket capP/EP/BROEROCE1YQuality 🔒Rank 🔒
Sagility Ltd₹20,219 Cr20.81.83.4%4.7%−6.6%
L&T Technology Services Ltd₹35,104 Cr26.35.620.7%25.7%−21.1%
Netweb Technologies India Ltd₹29,730 Cr102.924.432.9%37.3%+28.6%
Inventurus Knowledge Solutions Ltd₹29,596 Cr37.612.737.6%43.6%+12.5%
Tata Technologies Ltd₹29,083 Cr52.211.733.3%36.1%+2.2%
Affle 3i Ltd₹20,054 Cr41.79.85.5%8.1%−27.2%
ESDS Software Solution Ltd₹18,415 Cr——17.6%20.4%+73.0%
Black Box Ltd₹16,421 Cr64.011.33.8%4.3%+61.0%
E2E Networks Ltd₹15,120 Cr—2.5-0.9%-0.5%+122.9%
Cyient Ltd₹12,826 Cr33.82.38.0%15.9%−0.8%
Amagi Media Labs Ltd₹12,498 Cr119.84.31.5%1.3%+63.0%
Peer median—46.99.812.8%18.2%+16.7%
Market cap in rupees crore; P/E and P/B on the latest price; 1Y is the price return over a year. A dash is a figure that does not apply or is not reported.

Full peer comparison

🔒 Pro
Every peer, every figure, the ranks and the quality and forensic scores side by side: in the app.

Who owns Sagility?

Sagility is held by promoters 51.0%, foreign institutions 10.0%, domestic institutions 21.4%.

Shareholding pattern

Latest filing, percent of shares
Promoters51.0%
The founders and controlling group.
Foreign institutions10.0%
Overseas funds investing through the FPI route.
Domestic institutions21.4%
Indian insurers, banks, pension and mutual funds together.
Mutual funds13.4%
Indian mutual fund schemes; part of domestic institutions.
Retail and others8.6%
Individual investors and everyone else.
Promoter shares pledged🔒 In the app
Promoter shares given as collateral for loans; a high share is a risk to watch.
Holding trend🔒 In the app
Whether promoters, foreign funds and mutual funds have been adding or selling over recent quarters.

What do analysts say about Sagility?

9 analysts cover Sagility, and the consensus is buy. A consensus is a count of opinions, not a forecast; read it beside the numbers.

Analyst consensus

9 analysts
ConsensusBuy
The rating most covering analysts give the share.
Average target price🔒 In the app
The mean of the analysts' 12-month price targets.
Upside to target🔒 In the app
How far the target sits above or below today's price.
Share rating it a buy🔒 In the app
The share of covering analysts with a buy rating.

What does Sagility do and what is it sensitive to?

Sagility India Limited provides technology-enabled business process services to U.S. Sensitive to: USD/INR exchange rate.

Business-model card

FY2025 · 41 verified
3Revenue
4Channels
2Regulators
3Reg. dependencies
5Sensitivities
4Costs
2Geographies

Sagility India Limited provides technology-enabled business process services to U.S. healthcare payers (health insurers, including PBM services) and providers (hospitals, physicians, diagnostic and device companies). Per its accounting policy, it earns revenue through revenue-share arrangements with its U.S. subsidiaries, based on the end-client revenue.

Revenue engine

3 verified
Payer clients
Revenue from payers, which the excerpt describes as covering benefits administration, clinical functions and PBM services included in the payer segment.
Provider clients
Revenue cycle management services to providers, including financial clearance, medical coding, billing and accounts receivable follow-up.
PBM services within payer segment
Pharmacy benefit manager services are reported inside the payer segment rather than as a separate line.

Customers & channels

4 verified
Top 10 client concentration
Revenue depends heavily on a few large clients, so loss or repricing of a large client moves total revenue.
Top 5 client groups tenure
Long-running relationships with the largest client groups, which the excerpt links to client retention.
U.S. payers as clients
Payers are described as a consolidated market in which the company serves six of the top 10 payers.
1 more statement
Three customers above 10% of revenue
Consolidated accounts flag three customers each above 10% of total revenue, so contract loss at any one is material.

Regulators

2 verified
STPI
The company is registered with STPI for export of services, which the excerpt links to its foreign-exchange earnings.
U.S. licensing authorities for TPA, PBM and utilization review
Operating as a third-party administrator, PBM or utilization review entity requires U.S. licences; the excerpt names these as licensing requirements.

Regulatory dependencies

3 verified
U.S. licensing for TPA, PBM and utilization review
Licensing requirements apply to the services sold; non-compliance is a stated risk to the business.
HIPAA, HITECH and CCPA data rules
Non-compliance could bring penalties and reputational damage, so stricter data rules raise compliance cost and affect outsourcing demand.
CMS value-based care transition
Interpretation: a faster shift of Medicare and Medicaid beneficiaries to value-based models would change the mix of payer administrative work the company sells.

Sensitivities

5 verified
USD/INR exchange rate
The table shows a 5% USD increase with a profit-after-tax impact of (8.63) million for 31 March 2025 and 9.78 for 31 March 2024 in the other row ordering.
Currency effect on reported revenue
Reported revenue growth includes currency fluctuations, so the company also reports constant-currency growth.
U.S. healthcare spending
Interpretation: lower commercial or government healthcare spending would reduce demand for the company's services.
2 more statements
In-house shift by clients
A shift toward in-house models would reduce outsourcing volumes.
Trade receivable concentration and credit period
Receivables are concentrated in a few customers on 60–90 day credit terms, so payment delays from a large client affect working capital.

Cost inputs

4 verified
Employee benefits expense (62.8%)
Staff cost is the largest cost line; it rose as a share of revenue in FY25 with a one-time share-based payment charge.
Share-based payment award modification
A one-time rise in fair value of awards, from cash-settled to equity-settled, lifted employee cost in FY25.
Offshoring
Employee cost excluding share-based awards fell as a share of revenue, which the company attributes to increased offshoring.
1 more statement
Other expenses
Other expenses fell as a share of revenue on lower legal and professional expense and better site utilisation.

Geographies

2 verified
United States clients
All clients are located in the U.S., so U.S. healthcare demand is the single market.
Global delivery locations
Delivery centres in India, the Philippines, the U.S., Jamaica and Colombia serve the U.S. client base.
Each statement is checked word for word against the FY2025 annual report; the passages are in the app.

What changed recently?

Dividend - Re 0.10 Per Share (7 Aug 2026).

Change log

8 entries · newest first
  1. Corporate actionDividend - Re 0.10 Per Share.
  2. Results filedQ1 FY2027 results filed.
  3. Results filedQ4 FY2026 results filed.
  4. Results filedQ3 FY2026 results filed.
  5. Corporate actionInterim Dividend - Re 0.05 Per Share.
  6. Results filedQ2 FY2026 results filed.
  7. Results filedQ1 FY2026 results filed.
  8. Results filedQ4 FY2025 results filed.
Get alerts →Sign in to be told when any of these change.

What this page does not tell you

What could not be judged, and why. Never empty.
  • Models not runFair value, EPV, Graham number, Graham value, Lynch, Owner earnings: no valuation stored; P/E vs own history: 0 of 36 months of P/E history.
  • FlagsCAUTION on 26 of 30 flags judged; 3 red; 4 could not be judged.
  • Data gapsDividend yield, Business quality, 5-year return, Wealth destroyer, Profit 5 years, EPS 5 years and 1 more: not available yet.
Not applicable to this company · 1
  • Altman ZAltman Z is a manufacturing model; a service business has no inventory or plant turnover for it to read.

What this page rests on

✓5 years of annual statements, through FY2026 (Mar-26)✓10 quarters of results✓21 months of month-end prices, adjusted for bonuses and splits○no valuation of ours yet✓business-model card FY2025 · 41 verified

Questions people ask

What is Sagility's share price today?

Sagility last traded at ₹43.28 on the NSE, as of 13 Oct 2026, 9:45 am IST, up 0.2% on the day, down 6.6% over a year. Its 52-week range is ₹36 to ₹58. The live price is in the app.

What is Sagility's market cap?

Sagility's market capitalisation is about ₹20,219 crore: what it would cost to buy every share at today's price. That makes it the 122nd largest small cap company we cover.

Is Sagility Ltd a large cap, mid cap or small cap?

Sagility Ltd (SAGILITY) is a small cap company in AMFI's classification for Jan-Jun 2026. SEBI's buckets go by rank on six-month average market capitalisation: the top 100 are large caps, 101 to 250 mid caps, the rest small caps.

What is Sagility Ltd's P/E ratio?

20.75, vs peers 46.9 · 1st of 9. Price divided by last year's earnings per share: how many years of today's profit you pay for.

Is Sagility Ltd overvalued?

Cheap, with low confidence: no valuation within 120 days; P/E 20.8 vs peers 46.9 (1st of 9); P/B 1.8 vs peers 9.8 (1st of 10).

How does Sagility Ltd make money?

Sagility India Limited provides technology-enabled business process services to U.S. healthcare payers (health insurers, including PBM services) and providers (hospitals, physicians, diagnostic and device companies). Per its accounting policy, it earns revenue through revenue-share arrangements with its U.S. subsidiaries, based on the end-client revenue.

Who are Sagility Ltd's peers?

Compared with 10 IT Enabled Services: L&T Technology Services Ltd, Netweb Technologies India Ltd, Inventurus Knowledge Solutions Ltd, Tata Technologies Ltd, Affle 3i Ltd and 5 more. The app shows how they compare on every figure.

Is this investment advice?

No. Valarth is a research and learning tool and is not a SEBI-registered investment adviser or research analyst. The figures come from the company's filings and the exchanges; what to do with them is your call.

How did Sagility do last quarter?

Sagility reported revenue of ₹1,963 Cr, up 29.1% on a year earlier and a net profit of ₹217 Cr, up 71.5% in the Jun 2026 quarter.

Who owns Sagility?

Sagility is held by promoters 51.0%, foreign institutions 10.0%, domestic institutions 21.4%.

Does Sagility pay a dividend?

Sagility last paid ₹0.10 a share, ex-dividend 7 Aug 2026; nothing in the past 12 months counts toward a yield.

What do analysts say about Sagility?

9 analysts cover Sagility, and the consensus is buy. A consensus is a count of opinions, not a forecast; read it beside the numbers.

More small cap companies

Everything on Sagility, and 6,621 other companies, with 212 filters and the full peer tables