TVS Holdings Ltd
What is TVS Holdings's share price today?
TVS Holdings last traded at ₹11,621.00 on the NSE, as of 12 Oct 2026, 11:00 pm IST, up 1.6% on the day, down 14.8% over a year. Its 52-week range is ₹11,422 to ₹16,297. The live price is in the app.
What is TVS Holdings's market cap?
TVS Holdings's market capitalisation is about ₹23,148 crore: what it would cost to buy every share at today's price. That makes it the 85th largest small cap company we cover.
Key facts
- Symbol
- NSE: TVSHLTD
- ISIN
- INE105A01035
- Cap bucket
- Small Cap, 85th largest by market cap
- Industry (NSE)
- Financial Services › Finance › Investment Company
- Listed since
- 2012
- Futures and options
- Not traded
Is TVS Holdings overvalued?
Fair, with low confidence: no valuation within 120 days; P/E 11.8 vs peers 47.6 (2nd of 11); P/B 16.1 vs peers 1.1 (11th of 12).
Valuation
Is TVS Holdings a quality business?
Quality score 84.8, 1st of 12 in its peer set; CLEAN on 15 of 22 lender flags judged.
Quality and risk
Lender scorecard
Get a sneak peek of Valarth
Has TVS Holdings made money for shareholders?
Not over these periods: −14.8% over one year.
Shareholder returns
Returns
Does TVS Holdings pay a dividend?
Yes. TVS Holdings's dividend yield is 0.62% at the latest price; the last payout was ₹1.83 a share, ex-dividend 2 Apr 2026.
Dividends
Is TVS Holdings growing?
Loan growth 15.4%; revenue 3 years 19.9% a year; eps 3 years 46.7% a year. History break: demerger 2023-08-24 in the 5-year growth figures.
Growth
How did TVS Holdings do last quarter?
TVS Holdings reported income of ₹17,083 Cr, up 29.2% on a year earlier and a net profit of ₹1,174 Cr, up 40.7% in the Jun 2026 quarter.
Latest quarter
How does TVS Holdings compare with its peers?
Compared with 11 Investment Company; 2nd of 11 on P/E; 1st of 12 on quality score.
Compared with 11 Investment Company
- TVS Holdings Ltd (this page)
- Jio Financial Services Ltd
- Aditya Birla Capital Ltd
- L&T Finance Ltd
- Tata Investment Corporation Ltd
- Cholamandalam Financial Holdings Ltd
- Maharashtra Scooters Ltd
- JSW Holdings Ltd
- Tsf Investments Ltd
- Religare Enterprises Ltd
- Pilani Investment & Industries Corporation Ltd
- Nalwa Sons Investments Ltd
TVS Holdings against its peers
Who owns TVS Holdings?
TVS Holdings is held by promoters 74.5%, foreign institutions 3.2%, domestic institutions 9.8%.
Shareholding pattern
What does TVS Holdings do and what is it sensitive to?
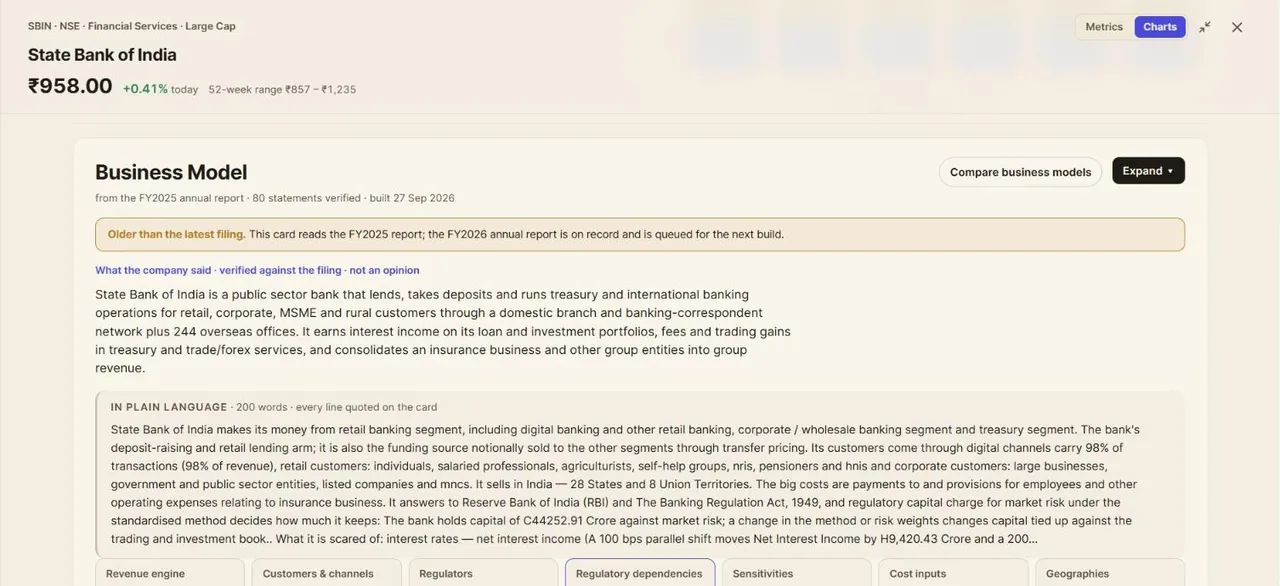
TVS Holdings Limited is registered with the RBI as a Core Investment Company (NBFC-CIC) that makes long-term strategic investments in group companies, and it reports investment income, dividends from a subsidiary, and services revenue. Sensitive to: interest rates.
Business-model card
TVS Holdings Limited is registered with the RBI as a Core Investment Company (NBFC-CIC) that makes long-term strategic investments in group companies, and it reports investment income, dividends from a subsidiary, and services revenue. Its standalone turnover is stated as 83% investments in group entities and 17% sale of spares, which it says it wound up effective 10 October 2024, and its only stated customers are group companies.
Revenue by segment
Revenue engine
3 more statements
Customers & channels
Regulators
Regulatory dependencies
1 more statement
Sensitivities
2 more statements
Cost inputs
1 more statement
Geographies
What changed recently?
Scheme Of Arrangement - Bonus Ncrps 46:1; price history adjusted (8 Sep 2026).
Change log
- Corporate actionScheme Of Arrangement - Bonus Ncrps 46:1; price history adjusted.
- Results filedQ1 FY2027 results filed.
- Results filedQ2 FY2026 results filed.
- Results filedQ4 FY2026 results filed.
- Corporate actionInterim Dividend - Rs 86 Per Share.
- Results filedQ3 FY2026 results filed.
- Results filedQ1 FY2026 results filed.
- Results filedQ4 FY2025 results filed.
What this page does not tell you
- Models not runFair value, EPV, Graham number, Graham value, Lynch, Owner earnings: no valuation stored.
- FlagsCLEAN on 15 of 22 lender flags judged; no red flag; 7 could not be judged.
- History breakDemerger 2023-08-24 in the 5-year growth figures: those figures span the accounts before and after it.
- Data gapsBusiness quality, Gross NPA, Net NPA, Provision coverage, CET1 ratio, Deposit growth YoY and 4 more: not available yet.
Not applicable to a bank, lender or insurer · 12
- Altman ZAltman Z reads working capital and sales over assets, which a lender's balance sheet does not have.
- Piotroski F-scorePiotroski's leverage and liquidity checks read deposits and borrowings as weakness.
- Beneish M-scoreThe Beneish model reads receivables, margins and depreciation that a lender's accounts do not report.
- Operating marginInterest is a lender's cost of goods, so operating profit before interest is not defined.
- Interest coverageInterest is a lender's main cost, not a charge on operating profit.
- Debt to equityBorrowings and deposits are a lender's raw material; gearing is judged by capital adequacy instead.
- EV/EBITDAEnterprise value adds borrowings to market cap; for a lender borrowings are the business, not a claim on it.
- FCF yieldOperating cash flow less capex is not free cash flow for a lender: loan growth sits in operating cash flow.
- Cash conversion cycleA lender's receivables are its loan book, not invoices waiting to be paid.
- Asset turnoverA lender earns a spread on its assets, not a turnover of them.
- ROCEEBIT over capital employed reads a lender's interest income against its borrowings; return on assets and return on equity are the lender's measures.
- ROCE, 10-year averageEBIT over capital employed reads a lender's interest income against its borrowings; return on assets is the lender's measure (HDFC Bank's 1.7% ten-year ROCE means nothing).
What this page rests on
Questions people ask
What is TVS Holdings's share price today?
TVS Holdings last traded at ₹11,621.00 on the NSE, as of 12 Oct 2026, 11:00 pm IST, up 1.6% on the day, down 14.8% over a year. Its 52-week range is ₹11,422 to ₹16,297. The live price is in the app.
What is TVS Holdings's market cap?
TVS Holdings's market capitalisation is about ₹23,148 crore: what it would cost to buy every share at today's price. That makes it the 85th largest small cap company we cover.
Is TVS Holdings Ltd a large cap, mid cap or small cap?
TVS Holdings Ltd (TVSHLTD) is a small cap company in AMFI's classification for Jan-Jun 2026. SEBI's buckets go by rank on six-month average market capitalisation: the top 100 are large caps, 101 to 250 mid caps, the rest small caps.
What is TVS Holdings Ltd's P/E ratio?
11.75, vs peers 47.6 · 2nd of 11. Price divided by last year's earnings per share: how many years of today's profit you pay for.
Is TVS Holdings Ltd overvalued?
Fair, with low confidence: no valuation within 120 days; P/E 11.8 vs peers 47.6 (2nd of 11); P/B 16.1 vs peers 1.1 (11th of 12).
How does TVS Holdings Ltd make money?
TVS Holdings Limited is registered with the RBI as a Core Investment Company (NBFC-CIC) that makes long-term strategic investments in group companies, and it reports investment income, dividends from a subsidiary, and services revenue. Its standalone turnover is stated as 83% investments in group entities and 17% sale of spares, which it says it wound up effective 10 October 2024, and its only stated customers are group companies.
Why is there no Altman Z or debt to equity for TVS Holdings?
Borrowing is a bank's or lender's raw material, so those ratios mislead. Net interest margin, gross NPA, return on assets and the capital ratios are shown instead.
Who are TVS Holdings Ltd's peers?
Compared with 11 Investment Company: Jio Financial Services Ltd, Aditya Birla Capital Ltd, L&T Finance Ltd, Tata Investment Corporation Ltd, Cholamandalam Financial Holdings Ltd and 6 more. The app shows how they compare on every figure.
Is this investment advice?
No. Valarth is a research and learning tool and is not a SEBI-registered investment adviser or research analyst. The figures come from the company's filings and the exchanges; what to do with them is your call.
How did TVS Holdings do last quarter?
TVS Holdings reported income of ₹17,083 Cr, up 29.2% on a year earlier and a net profit of ₹1,174 Cr, up 40.7% in the Jun 2026 quarter.
Who owns TVS Holdings?
TVS Holdings is held by promoters 74.5%, foreign institutions 3.2%, domestic institutions 9.8%.
Does TVS Holdings pay a dividend?
Yes. TVS Holdings's dividend yield is 0.62% at the latest price; the last payout was ₹1.83 a share, ex-dividend 2 Apr 2026.