Who makes India's machines and pipes
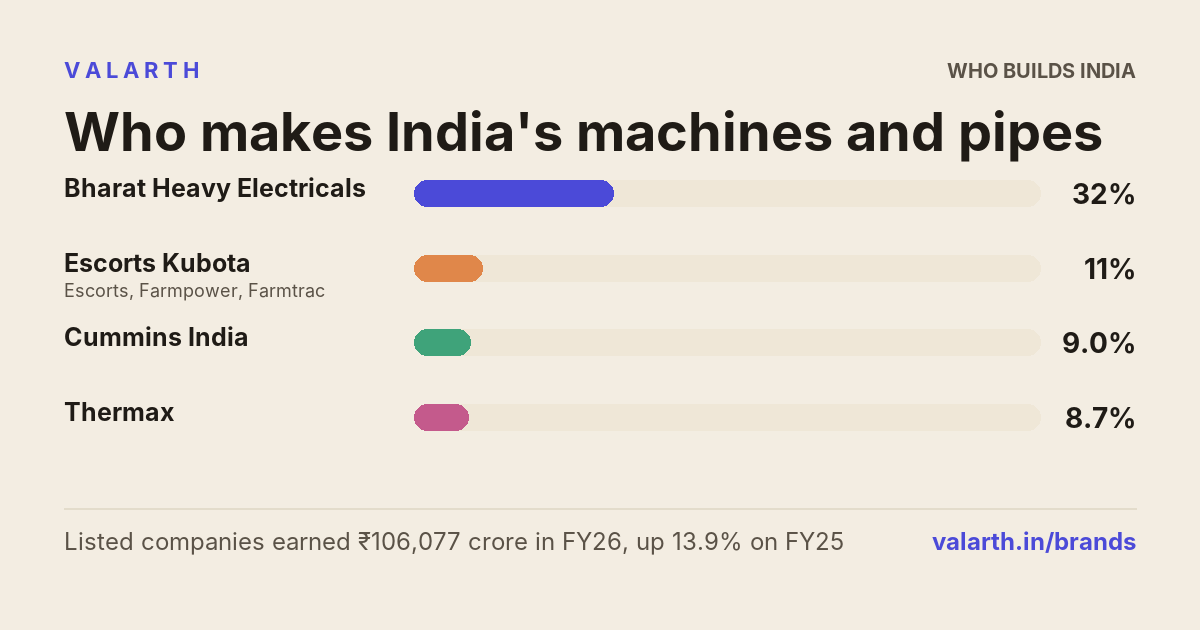
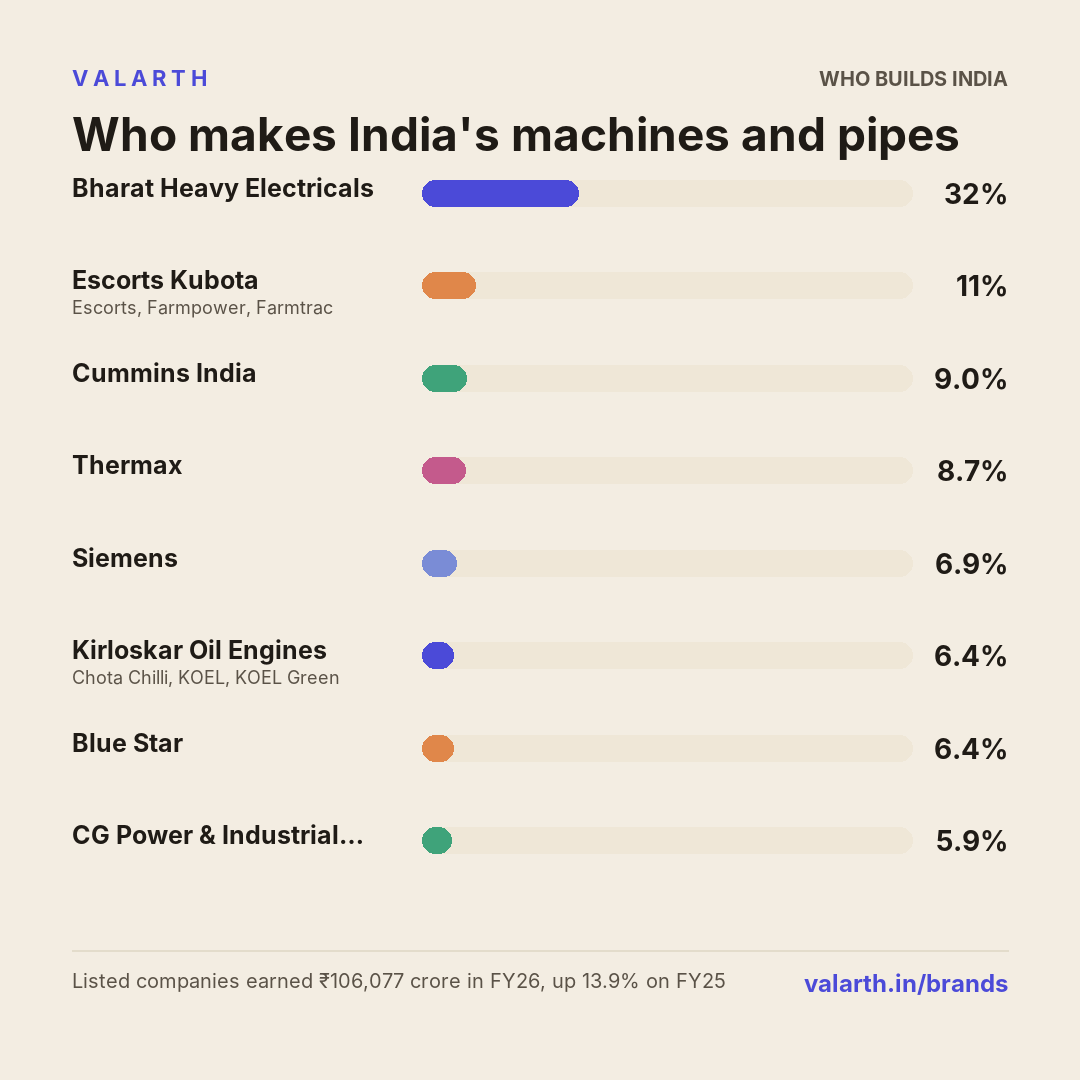
17 listed companies earned ₹106,077 crore from industrial machinery and products in FY26, up 13.9% on FY25. Bharat Heavy Electricals Ltd earned the most, 31.8% of it. AIA Engineering Ltd earned the most on each rupee of sales: 36.5%.
The brands, and who owns them
Escorts, Farmpower, Farmtrac, Powertrac and others are Escorts Kubota Ltd's; Chota Chilli, KOEL, KOEL Green, Varuna Electric and others are Kirloskar Oil Engines Ltd's; Honeywell Process Solutions is Honeywell Automation India Ltd's. Brands are read from each company's filings and checked against a public source.
Who sells the most
Bharat Heavy Electricals Ltd had 31.8% of the listed companies' revenue from industrial machinery and products here, 2.9 times as much as Escorts Kubota Ltd, the next largest. The two together sold 43%; the other 15 the rest.
How the sales have grown, and who sold them
The listed companies here earned ₹1.06 lakh Cr from industrial machinery and products in FY26. Counting only the companies with figures in both years, sales went from ₹3,190 Cr in FY19 to ₹4,420 Cr. The biggest rise was in FY23 (+38%) and the weakest year FY20 (-2%). Bharat Heavy Electricals Ltd's part of the total went from 33% in FY25 to 32% in FY26. Over three years CG Power & Industrial Solutions Ltd grew fastest, +16.0% a year. Some companies are counted only from a later year (Bharat Heavy Electricals Ltd from FY25; Escorts Kubota Ltd from FY25; Cummins India Ltd from FY25; Thermax Ltd from FY25; Siemens Ltd from FY26; Kirloskar Oil Engines Ltd from FY25; Blue Star Ltd from FY25; CG Power & Industrial Solutions Ltd from FY23; Cochin Shipyard Ltd from FY25; 3M India Ltd from FY25; Honeywell Automation India Ltd from FY23; Supreme Industries Ltd from FY26; Craftsman Automation Ltd from FY25; Voltas Ltd from FY25; Suzlon Energy Ltd from FY25; Tube Investments of India Ltd from FY25).
Who earns the most on each rupee
Operating profit before interest and tax, as a share of revenue from industrial machinery and products. Bharat Heavy Electricals Ltd earned 12.2% on its sales in FY26, against 8.7% in FY25. Escorts Kubota Ltd earned 11.8% on its sales in FY26, against 10.5% in FY25. Cummins India Ltd earned 31.1% on its sales in FY26, against 30.0% in FY25. Thermax Ltd earned 8.2% on its sales in FY26, against 7.1% in FY25. Kirloskar Oil Engines Ltd earned 10.2% on its sales in FY26, against 9.5% in FY25.
The companies, and their brands
| Company and brands | Sales FY26 | Growth 1 yr | 3 yrs | 5 yrs | Margin | Profit share | Return on assets | P/E | ROE | Share price 1 yr |
|---|---|---|---|---|---|---|---|---|---|---|
| Bharat Heavy Electricals Ltd | ₹33,782 Cr | +19.2% | — | — | 12.2% | 29.9% | 6.9% | 63.3 | 5.2% | +90.3% |
| Escorts Kubota Ltd Escorts, Farmpower, Farmtrac, Powertrac, Digitrac, Farmtrac Promaxx, Hydra, MistTrac 600, ProMax, Promaxx, Shaurya, Steeltrac Sells in 28 states and 71 countries; exports 5.54% of turnover |
₹11,527 Cr | +12.6% | — | — | 11.8% | 9.8% | 24.4% | 21.3 | 19.5% | -26.1% |
| Cummins India Ltd | ₹9,546 Cr | +14.9% | — | — | 31.1% | 21.5% | 26.3% | 56.6 | 31.2% | +22.5% |
| Thermax Ltd | ₹9,237 Cr | +2.9% | — | — | 8.2% | 5.5% | 15.1% | 62.6 | 11.3% | +6.2% |
| Siemens Ltd | ₹7,316 Cr | — | — | — | 5.1% | 2.7% | 18.3% | 40.7 | 12.0% | +20.4% |
| Kirloskar Oil Engines Ltd Chota Chilli, KOEL, KOEL Green, Varuna Electric, Kirloskar Nulife, Kirloslar Nulife, KOEL Electric, KOEL iGreen, Mega T, OptiPrime, Patriot, Wildcat Power Gen Exports 9.94% of turnover |
₹6,824 Cr | +22.6% | — | — | 10.2% | 5.0% | 20.6% | 58.0 | 14.6% | +150.8% |
| Blue Star Ltd | ₹6,763 Cr | +12.8% | — | — | 7.4% | 3.6% | 13.6% | 64.4 | 13.0% | -15.2% |
| CG Power & Industrial Solutions Ltd Sells in 27 states and 20 countries; exports 4.0% of turnover |
₹6,232 Cr estimate |
+7.1% | +16.0% | — | — | — | — | 107.6 | 21.4% | +14.5% |
| AIA Engineering Ltd | ₹4,420 Cr | +3.1% | -4.9% | +7.7% | 36.5% | 11.7% | — | 27.6 | 17.6% | +16.0% |
| Cochin Shipyard Ltd | ₹3,366 Cr | +13.9% | — | — | 20.0% | 4.9% | 6.5% | 48.9 | 11.2% | -29.1% |
| 3M India Ltd Sells in 36 states and 21 countries; exports 0.99% of turnover |
₹1,640 Cr | +16.0% | — | — | 15.7% | 1.9% | 38.5% | 60.0 | 28.9% | +5.8% |
| Honeywell Automation India Ltd Honeywell Process Solutions Sells in 33 states and 60 countries; exports 33.13% of turnover |
₹1,358 Cr estimate |
+11.8% | +2.8% | — | — | — | — | 52.2 | 12.3% | -9.8% |
| Supreme Industries Ltd Sells in 34 states and 55 countries; exports 2.09% of turnover |
₹1,278 Cr | — | — | — | 7.7% | 0.7% | — | 43.1 | 17.5% | -15.9% |
| Craftsman Automation Ltd | ₹1,102 Cr | +30.2% | — | — | 4.4% | 0.4% | 3.7% | 53.1 | 7.6% | +64.8% |
| Voltas Ltd Sells in 28 states and 18 countries; exports 0.27% of turnover |
₹598 Cr | +5.2% | — | — | 26.5% | 1.1% | 62.8% | 76.7 | 4.2% | -25.2% |
| Suzlon Energy Ltd | ₹581 Cr | +22.6% | — | — | 14.9% | 0.6% | 14.9% | 17.6 | 38.1% | -25.5% |
| Tube Investments of India Ltd | ₹508 Cr | -14.0% | — | — | 21.1% | 0.8% | 19.6% | 70.0 | 14.8% | -29.2% |
Also sold by
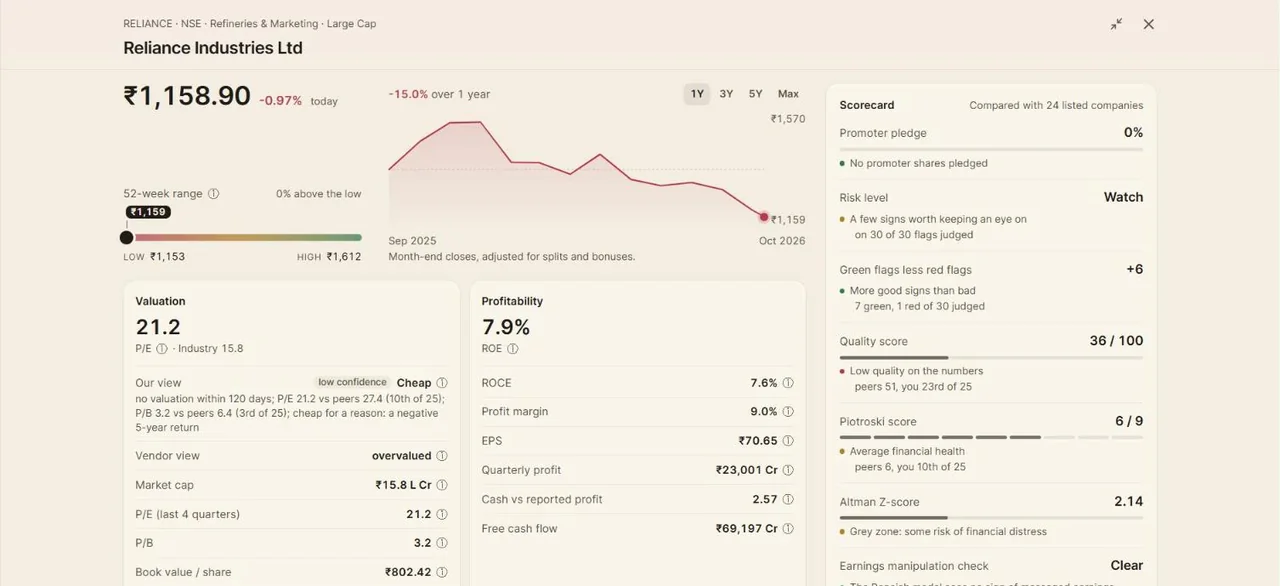
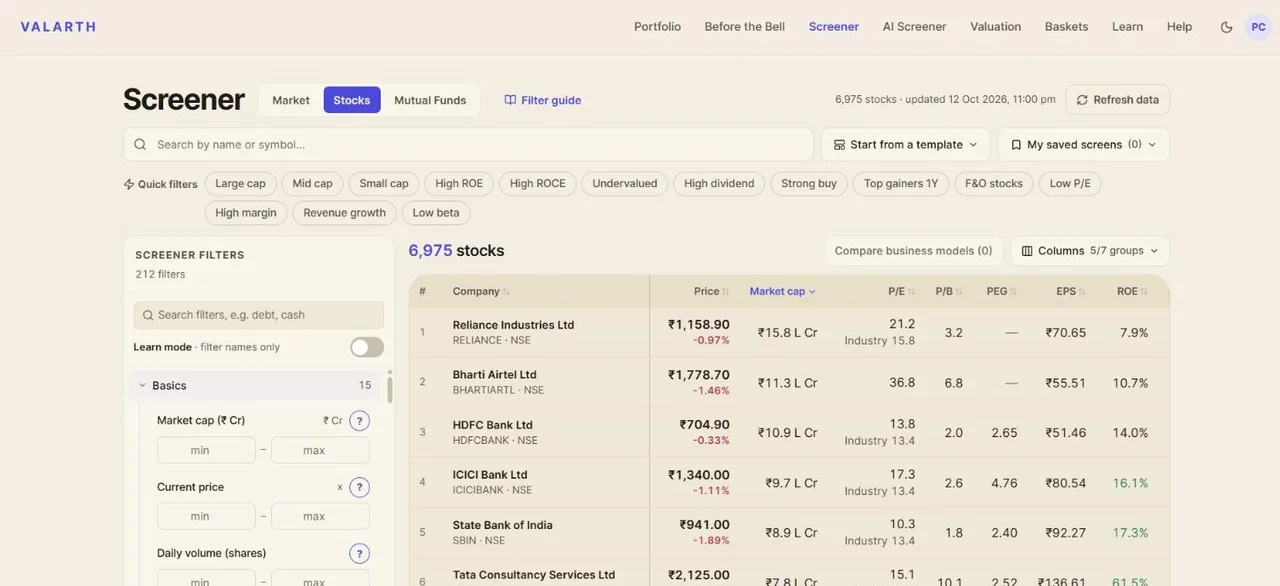
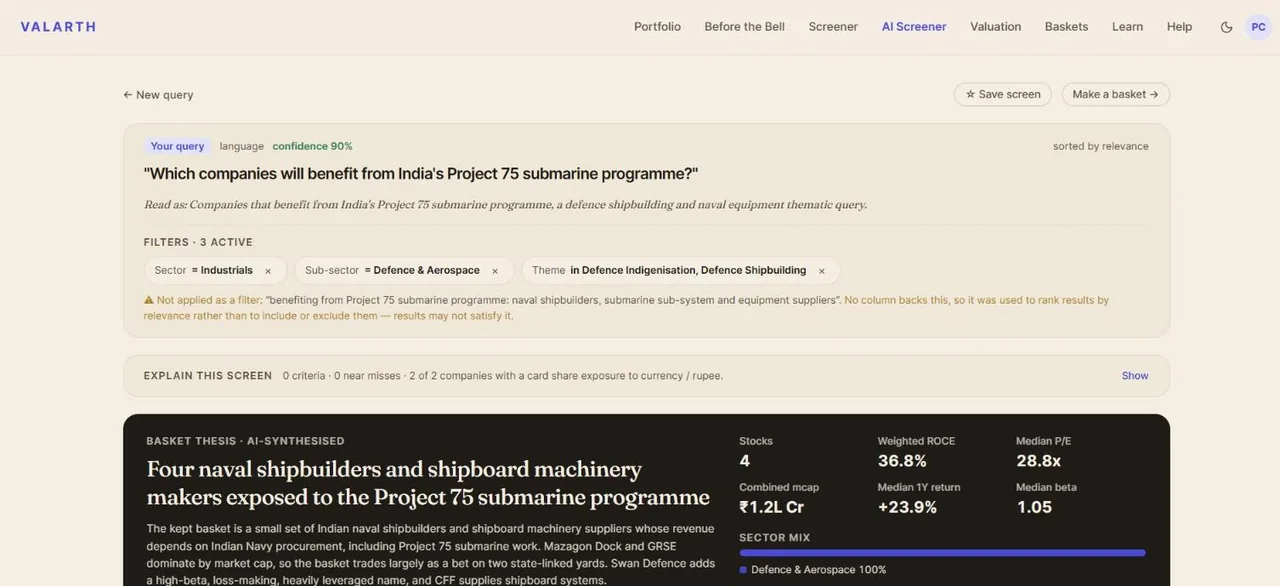
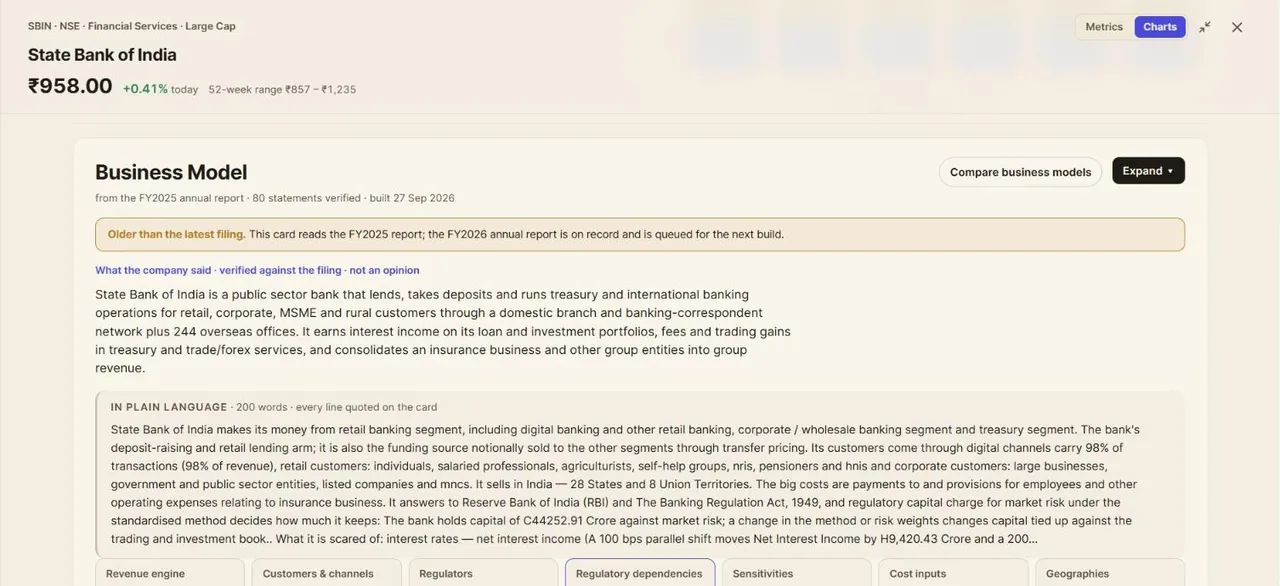
See every one of these companies in Valarth
Questions people ask
Who makes India's machines and pipes?
17 listed companies report their revenue from industrial machinery and products: Bharat Heavy Electricals Ltd (BHEL), Escorts Kubota Ltd (ESCORTS), Cummins India Ltd (CUMMINSIND), Thermax Ltd (THERMAX), Siemens Ltd (SIEMENS), Kirloskar Oil Engines Ltd (KIRLOSENG), Blue Star Ltd (BLUESTARCO), CG Power & Industrial Solutions Ltd (CGPOWER). 3 more sell them but report them together with other products.
Which listed company earns the most from industrial machinery and products in India?
Bharat Heavy Electricals Ltd, with revenue from industrial machinery and products of ₹33,782 crore in FY26: 31.8% of the listed companies' total here.
How much do listed companies earn from industrial machinery and products?
The listed companies here earned ₹106,077 crore from industrial machinery and products in FY26, up 13.9% on FY25. Private makers are not included.
Which listed company makes the most profit from industrial machinery and products?
AIA Engineering Ltd: its operating profit was 36.5% of its revenue from industrial machinery and products in FY26.
Who owns Escorts?
Escorts is a brand of Escorts Kubota Ltd, listed on the NSE as ESCORTS.
Who owns Farmpower?
Farmpower is a brand of Escorts Kubota Ltd, listed on the NSE as ESCORTS.
Who owns Chota Chilli?
Chota Chilli is a brand of Kirloskar Oil Engines Ltd, listed on the NSE as KIRLOSENG.
Who owns KOEL?
KOEL is a brand of Kirloskar Oil Engines Ltd, listed on the NSE as KIRLOSENG.
Who owns Honeywell Process Solutions?
Honeywell Process Solutions is a brand of Honeywell Automation India Ltd, listed on the NSE as HONAUT.