VALARTH See Maruti Suzuki India in the appOpen in app
MARUTI · NSE · Passenger Cars & Utility Vehicles

Maruti Suzuki India Ltd

What the numbers mean, from its filings and the exchange. Data as of 12 Oct 2026.
Large Cap · AMFI list Jan-Jun 2026 · Vendor sector: Consumer Cyclical
cheap low confidence No valuation within 120 days; P/E 25.1 vs peers 27.5 (4th of 7); P/B 3.7 vs peers 7.2 (1st of 9).
Statements through FY2026Prices adjusted for corporate actionsNot yet reviewed by the adversarial model

What is Maruti Suzuki India's share price today?

Maruti Suzuki India last traded at ₹11,315.00 on the NSE, as of 12 Oct 2026, 11:00 pm IST, down 0.9% on the day, down 30.0% over a year. Its 52-week range is ₹11,225 to ₹17,370. The live price is in the app.

₹11,315.00 −0.9% today
−30.0% over 1 year · NSE, as of 12 Oct 2026, 11:00 pm IST
60 month-end closes, 31 Oct 2021 to 30 Sep 2026, adjusted for splits and bonuses
52-week range1% of the way up
Low ₹11,225High ₹17,370

What is Maruti Suzuki India's market cap?

Maruti Suzuki India's market capitalisation is about ₹3.59 lakh crore: what it would cost to buy every share at today's price. That makes it the 19th largest large cap company we cover.

₹3.6 L Cr Large Cap19th largest large cap company
Large Cap means the 100 largest listed companies, under SEBI's rules. Shares in issue are worked out from the market cap and the price. What market cap tells you →

Key facts

From the exchange
Symbol
NSE: MARUTI
ISIN
INE585B01010
Cap bucket
Large Cap, 19th largest by market cap
Industry (NSE)
Consumer Discretionary › Automobile and Auto Components › Automobiles › Passenger Cars & Utility Vehicles
Listed since
2003
Futures and options
Traded

Is Maruti Suzuki India overvalued?

Cheap, with low confidence: no valuation within 120 days; P/E 25.1 vs peers 27.5 (4th of 7); P/B 3.7 vs peers 7.2 (1st of 9).

Valuation

Latest price and trailing 12 months
P/E 25.05
vs peers 27.5 · 4th of 7
Price divided by last year's earnings per share: how many years of today's profit you pay for. Learn more →
P/B 3.68
vs peers 7.2 · 1st of 9
Price divided by book value per share: what you pay for each rupee of net assets on the balance sheet. Learn more →
Market cap ₹3.59 lakh Cr
Total market value of all shares, in ₹ crore. Learn more →
Dividend yield Not available
Last year's dividends as a share of today's price. Learn more →
PEG (vendor) Not available
P/E divided by the vendor's earnings growth figure, which it does not disclose; a P/E adjusted for how fast profits grow. Learn more →
PEG on our 3-year EPS growth 1.28
P/E divided by the 3-year EPS growth rate from the stored accounts. Learn more →
3 models could be judged
Skipped — Fair value, EPV, Graham number, Graham value, Lynch, Owner earnings: no valuation stored

Our valuation range

🔒 Pro
Value range, implied growth at today's price, and the nine models behind it: in the app.

Is Maruti Suzuki India a quality business?

Quality score 52.1, 4th of 9 in its peer set; CLEAN on 30 of 30 flags judged.

Quality and risk

Data as of 12 Oct 2026
Business quality Not available
The kind of business, which sets the yardstick it is judged by. Learn more →
Quality score 52.1
vs peers 47.5 · 4th of 9
Returns, margins, leverage and consistency against its peers, out of 100. Learn more →
Risk level CLEAN
30 of 30 flags judged
From flags on debt, earnings quality, dilution and price swings. Learn more →

Profitability

ROE 14.5%
vs peers 29.3% · 8th of 8
Return on equity: profit as a share of shareholders' money. Learn more →
ROCE 18.5%
vs peers 32.4% · 7th of 8
Return on capital employed: operating profit as a share of all the capital in the business, debt and equity. Learn more →
Profit margin 7.1%
vs peers 10.5% · 6th of 8
Profit after everything, as a share of revenue. Learn more →
EPS ₹466.91
Trailing 12 months
Profit for each share over the last 12 months.

Scorecard

🔒 Pro
Health scores and red flags with their values and history: in the app.
Inside the app

Get a sneak peek of Valarth

Start freeStart free
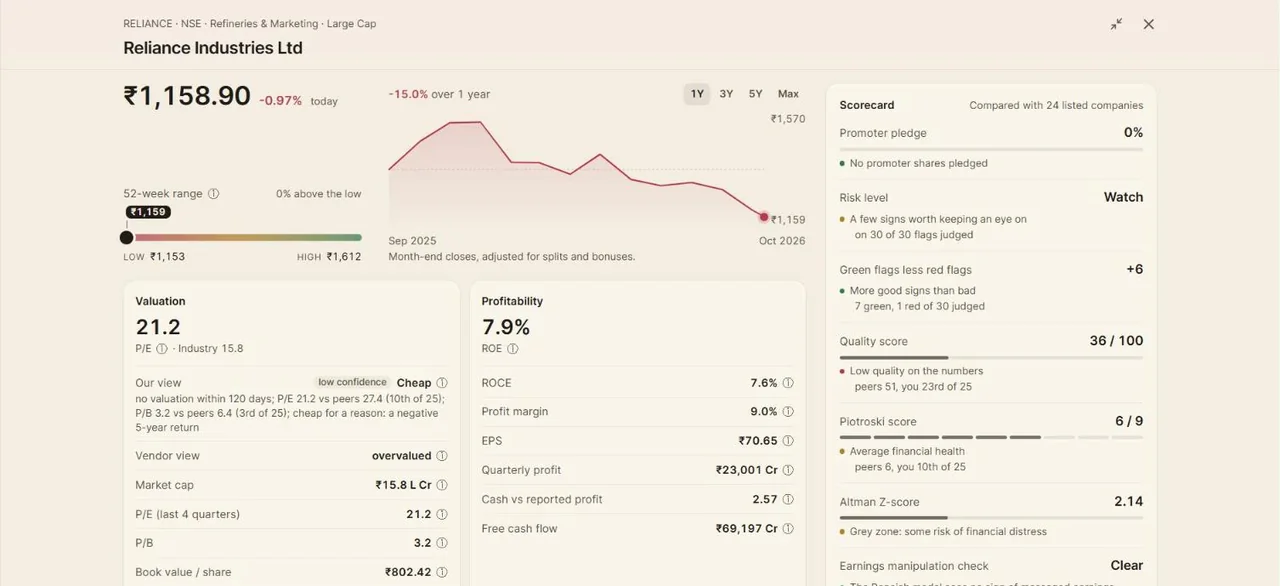
A Valarth stock page: the share price with its chart and 52-week range, valuation and profitability figures, and a scorecard of health checks.
Stock pagePrice, valuation, profitability and a scorecard of health checks for every company, each figure explained.
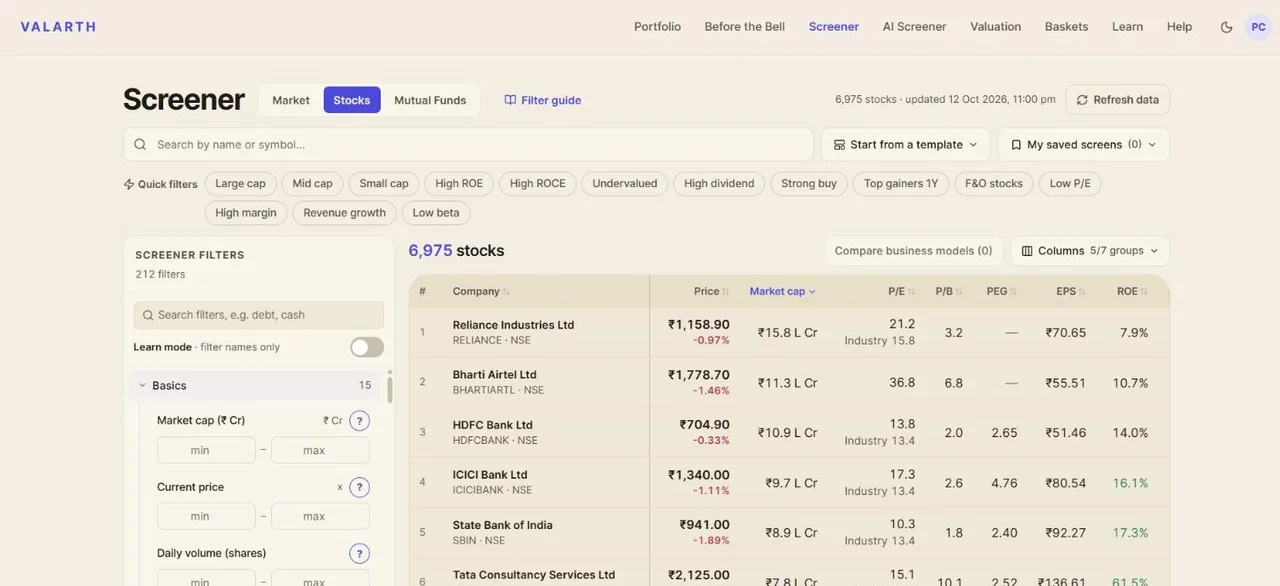
The Valarth stock screener: a table of companies with price, market cap, P/E, P/B, PEG, EPS and ROE, and filters down the left.
ScreenerEvery listed company, filtered on 212 figures, each with a plain-language lesson beside it.
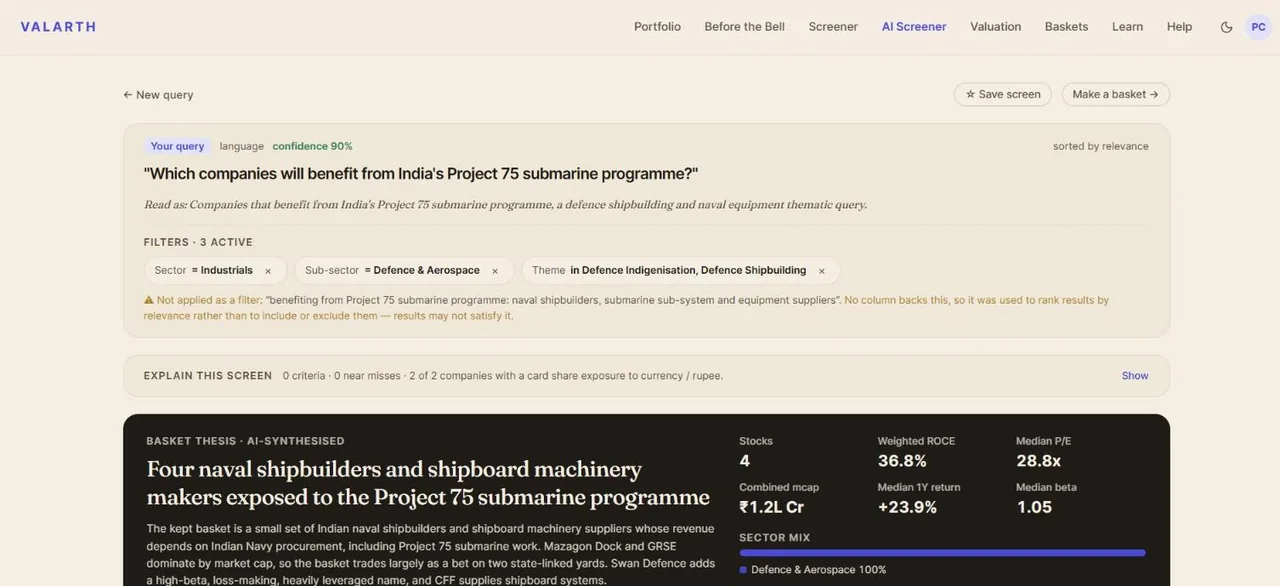
The Valarth AI Screener answering 'Which companies will benefit from India's Project 75 submarine programme?' with a basket of four naval shipbuilders and a written thesis.
AI ScreenerAsk a question in plain English, like which companies benefit from India's Project 75. It reads the intent, builds the screen and writes the thesis.
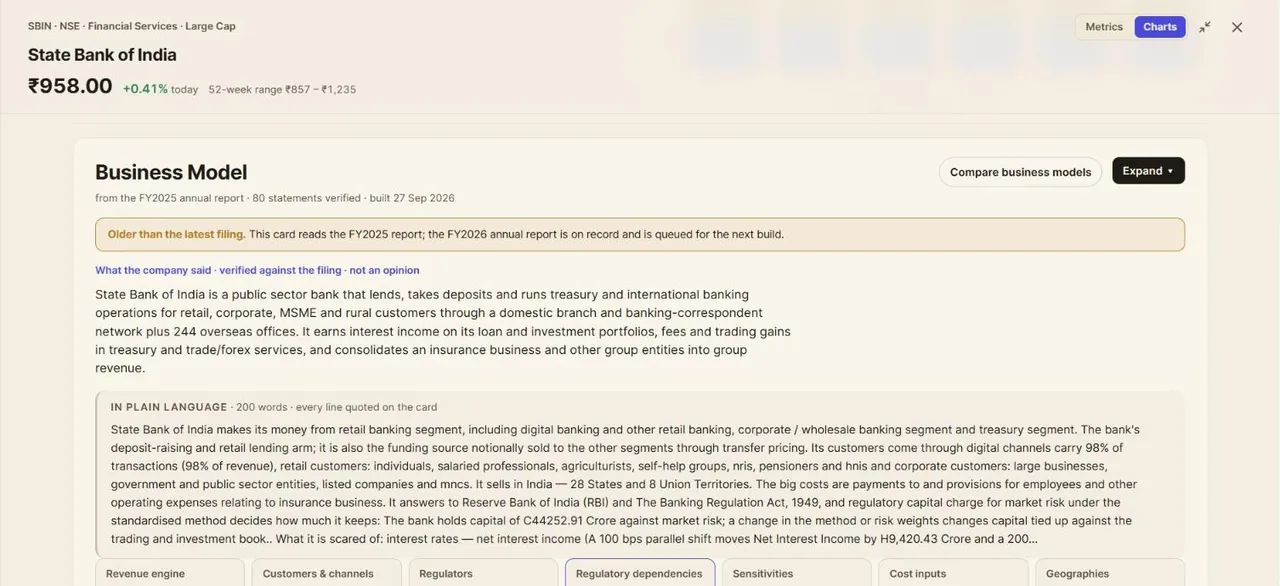
A Valarth business-model card for State Bank of India, with a plain-language summary and statements verified against the filing.
Business modelHow a company makes money and what can hurt it, each statement checked against its annual report.
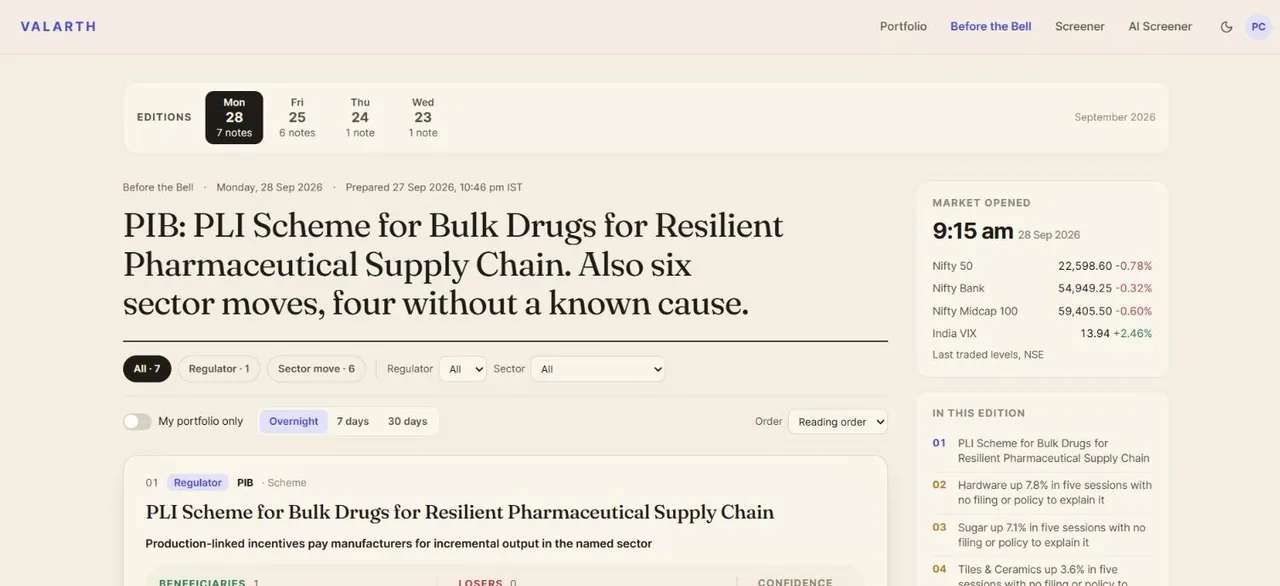
Valarth's Before the Bell edition, with the day's headline, regulator notes and sector moves.
Before the BellA morning edition before the market opens: what moved, which rule changed, and what it means for your holdings.

Has Maruti Suzuki India made money for shareholders?

Mixed: −30.0% over one year and +10.3% a year over five years.

Shareholder returns

1-year return −30.0%
Price only
What the share price did over the last 12 months. Learn more →
5-year return +10.3% a year
Price only
Yearly average price return over five years, bonuses and splits adjusted. Learn more →
Wealth destroyer No
Five-year total return — price CAGR on bonus- and split-adjusted closes plus the dividend yield — below the 7% a bank fixed deposit paid. Learn more →

Returns

3Y and 5Y are yearly averages
1W
−1.0%
1M
−6.6%
3M
−16.6%
6M
−12.7%
1Y
−30.0%
3Y
+4.8%
5Y
+10.3%

Does Maruti Suzuki India pay a dividend?

Maruti Suzuki India last paid ₹140.00 a share, ex-dividend 7 Aug 2026; nothing in the past 12 months counts toward a yield.

Dividends

Per share, by ex-dividend date
7 Aug 2026 · Final₹140.00
1 Aug 2025 · Final₹135.00
2 Aug 2024 · Final₹125.00
3 Aug 2023 · Final₹90.00
3 Aug 2022 · Final₹60.00
Payout ratio🔒 In the app
The share of profit paid out as dividends; a very high share leaves little to reinvest.
Dividend growth, 5 years🔒 In the app
How fast the dividend per share has grown a year.
Years without a miss🔒 In the app
How many years in a row a dividend has been paid.

Is Maruti Suzuki India growing?

Revenue 3 years 15.9% a year; profit 3 years 21.1% a year; revenue 5 years 17.5% a year.

Growth

Statements through FY2026 (Mar-26)
Revenue 3 years 15.9% a year
vs peers 17.9% · 6th of 9
Compound annual growth of revenue over three years. Learn more →
Profit 3 years 21.1% a year
vs peers 23.7% · 5th of 8
Compound annual growth of net profit over three years. Learn more →
Revenue 5 years 17.5% a year
Compound annual growth of revenue over five years. Learn more →
Profit 5 years 29.9% a year
Compound annual growth of net profit over five years. Learn more →
EPS 3 years 19.5% a year
Growth in earnings per share, so dilution counts against the company. Learn more →
EPS 5 years 26.3% a year
Growth in earnings per share over five years, so dilution counts against the company. Learn more →
P/E vs own history -29.5%
vs peers -12.8% · 2nd of 7
Today's P/E against its own 5-year median; negative is cheaper than its history. Learn more →

How did Maruti Suzuki India do last quarter?

Maruti Suzuki India reported revenue of ₹51,708 Cr, up 19.9% on a year earlier and a net profit of ₹3,447 Cr, up 1.2% in the Jun 2026 quarter.

Latest quarter

Jun 2026
Revenue, latest quarter₹51,708 Cr
+19.9% on a year earlier
What the company took in over the quarter.
Net profit, latest quarter₹3,447 Cr
+1.2% on a year earlier
What was left for shareholders after every cost and tax.

How does Maruti Suzuki India compare with its peers?

Compared with 8 Automobiles (the industry, as the basic industry was too small); 4th of 7 on P/E; 4th of 9 on quality score.

Compared with 8 Automobiles (the industry, as the basic industry was too small)

8 companies

Maruti Suzuki India against its peers

Largest 8 of 8 peers, by market cap
CompanyMarket capP/EP/BROEROCE1YQuality 🔒Rank 🔒
Maruti Suzuki India Ltd₹3.6 L Cr25.13.714.5%18.5%−30.0%
Mahindra & Mahindra Ltd₹3.5 L Cr16.94.823.0%28.7%−19.2%
Bajaj Auto Ltd₹2.7 L Cr23.27.029.3%38.4%+7.8%
Eicher Motors Ltd₹1.9 L Cr33.58.325.0%31.2%+2.0%
TVS Motor Company Ltd₹1.8 L Cr53.614.234.2%37.1%+10.4%
Hyundai Motor India Ltd₹1.6 L Cr31.87.530.3%35.1%−18.6%
Tata Motors Passenger Vehicles Ltd₹1.0 L Cr—4.4302.8%15.1%−30.0%
Hero MotoCorp Ltd₹97,979 Cr18.04.725.5%32.4%−11.9%
Ather Energy Ltd₹56,905 Cr—11.2——+134.6%
Peer median—27.57.229.3%32.4%−5.0%
Market cap in rupees crore; P/E and P/B on the latest price; 1Y is the price return over a year. A dash is a figure that does not apply or is not reported.

Full peer comparison

🔒 Pro
Every peer, every figure, the ranks and the quality and forensic scores side by side: in the app.

Who owns Maruti Suzuki India?

Maruti Suzuki India is held by promoters 58.6%, foreign institutions 12.8%, domestic institutions 25.2%.

Shareholding pattern

Latest filing, percent of shares
Promoters58.6%
The founders and controlling group.
Foreign institutions12.8%
Overseas funds investing through the FPI route.
Domestic institutions25.2%
Indian insurers, banks, pension and mutual funds together.
Mutual funds15.3%
Indian mutual fund schemes; part of domestic institutions.
Retail and others2.7%
Individual investors and everyone else.
Promoter shares pledged🔒 In the app
Promoter shares given as collateral for loans; a high share is a risk to watch.
Holding trend🔒 In the app
Whether promoters, foreign funds and mutual funds have been adding or selling over recent quarters.

What do analysts say about Maruti Suzuki India?

37 analysts cover Maruti Suzuki India, and the consensus is buy. A consensus is a count of opinions, not a forecast; read it beside the numbers.

Analyst consensus

37 analysts
ConsensusBuy
The rating most covering analysts give the share.
Average target price🔒 In the app
The mean of the analysts' 12-month price targets.
Upside to target🔒 In the app
How far the target sits above or below today's price.
Share rating it a buy🔒 In the app
The share of covering analysts with a buy rating.

What does Maruti Suzuki India do and what is it sensitive to?

Maruti Suzuki India Limited manufactures and sells passenger vehicles, components, and spare parts for domestic and export markets. Sensitive to: GDP growth and economic expansion.

Business-model card

FY2025 · 70 verified
6Revenue
7Channels
5Regulators
7Reg. dependencies
6Sensitivities
7Costs
3Geographies

Maruti Suzuki India Limited manufactures and sells passenger vehicles, components, and spare parts for domestic and export markets. It earns revenue primarily from vehicle sales through multiple retail channels (Arena, NEXA, Commercial, True Value) and from aftermarket parts, services, and other ancillary operations.

Revenue by segment

Year ended March 31, 2025 (Consolidated)
Domestic85.1%
Overseas14.9%

Revenue engine

6 verified
Domestic passenger vehicle sales (85.0%)
Sales through Arena (3,232 outlets), NEXA (630 outlets), Commercial (373 outlets), and True Value (601 outlets) channels; domestic sales volumes grew 0.1% in FY2025 but exports offset this with 17.5% growth
Export sales of passenger vehicles (15.0%)
Exports to nearly 100 countries including South Africa, Saudi Arabia, Chile, Japan and Mexico; Company is India's largest exporter of passenger vehicles with 43% market share
Aftermarket parts and accessories
Over 95,500 parts distributed through 1,377 independent retail outlets and 5,424 service workshops; revenue recognised at transaction price upon dispatch
3 more statements
Service revenue and extended warranty
5,424 service touchpoints across 2,720 cities including mobile workshops and quick response teams; income from extended warranty recognised over the warranty period
Royalty income
Revenue from royalty recognised on accrual basis in accordance with licence agreements from Suzuki Motor Corporation
Sale of scrap and other incidental revenue
Revenue from sale of scrap recognised at transaction price upon dispatch; recovery of freight and service charges recognised upon arrangement of transportation

Customers & channels

7 verified
Arena sales channel
3,232 outlets across 2,744 cities targeting youthful, modern customers seeking dynamic and trendy car buying experience
NEXA premium sales channel
630 outlets across 421 cities targeting new customer segments with premium buying experience, innovative technology and enhanced hospitality
Commercial vehicles retail channel
373 outlets across 267 cities focused on commercial vehicle segment
4 more statements
True Value pre-owned car channel
601 outlets across 302 cities providing trusted destination for buyers of pre-owned cars at fair and transparent prices
Export markets
Individual consumers, government and corporate employees, fleet operators, and defence agencies across nearly 100 countries; exports represent 15% of total sales volume in FY2025
Service and aftermarket channel
5,424 service touchpoints including 2,720 cities, 503 mobile workshops and quick response teams; over 27 million customers engaged through sales and service activities
One material customer
The Company has one customer individually contributing to more than 10% of total revenues during FY2025, interpretation: likely Suzuki Motor Corporation or a related entity for OEM supply

Regulators

5 verified
Motor Vehicles Act, 1988
Laws specifically applicable to the automobile industry governing vehicle manufacturing, registration, and operation
Reserve Bank of India (RBI)
Macroeconomic stability and monetary policy affecting financing and credit conditions for vehicle purchases
Competition Commission of India (CCI)
Regulates anti-competitive conduct including aftermarket spare parts availability and pricing practices
2 more statements
Government of India regulatory bodies
Set emission standards (BS 6 and stricter), safety standards, and industrial policy affecting vehicle design and affordability
Ministry of Corporate Affairs and SEBI
Govern corporate governance, listing requirements, and financial disclosures for listed companies

Regulatory dependencies

7 verified
BS 6 and stricter emission and safety standards
Since FY2018-19 implementation of BS 6, these standards increased product development costs and entry-car segment prices by ~70%, reducing first-time buyer affordability and slowing industry growth to 4.4% CAGR
CNG refuelling network expansion and Government commitment
Government expansion of CNG refuelling infrastructure is expected to significantly boost demand for CNG-powered vehicles
Affordability policies and taxation on vehicles
Entry-car segment prices surged 70% since FY2018-19 due to regulatory changes, excluding 88% of households from safer transport and reducing first-time buyer participation; policy evolution toward affordability could help industry
4 more statements
Chinese export restrictions on rare earth magnets
Chinese government decision requiring licenses for export of rare earth magnets created supply uncertainty for the automobile industry; Company has managed without production loss so far
Free trade agreements
Government entry into landmark free trade agreement with United Kingdom is expected to form template for future agreements and help implement export market expansion policy
Product safety and vehicle quality compliance
Company must comply with evolving regulations on vehicle safety and must institutionalise zero-defect philosophy across value chain
Export promotion and 6-year export obligation
Company must fulfil export obligation within specified 6-year period; capacity expansion and export strategy are subject to government policy on automotive exports

Sensitivities

6 verified
GDP growth and economic expansion
Historically PV sales grew 1.5 times GDP growth; despite India's 6.5% GDP growth in FY2025, PV sales remained flat due to affordability challenges, showing decoupling at current price levels
Commodity prices (copper, aluminium, lead, palladium, platinum)
Company has ₹43,831 million exposure to commodity price volatility; hedging policy manages risk through commodity derivatives to mitigate impact on budgetary performance
First-time buyer affordability and market penetration
Declining participation from first-time buyers due to affordability challenges; car penetration in India ~30 per 1,000 people; 88% of households excluded from safer transport; recovery depends on affordability solutions
3 more statements
SUV demand and segment mix
SUVs now represent over 50% of PV sales and contribute to higher margins; hatchbacks and sedans, especially entry-level models, see declining demand; Company maintained margins despite challenging conditions
External shocks (heatwaves, elections, geo-political tensions)
FY2025 growth was affected by heatwave and national elections reducing showroom footfalls in Q1; supply chain affected by pandemic disruptions and geo-political restrictions
New-age buyer preferences for digital features and connected vehicles
Customer expectations evolving rapidly; new-age buyers seek premium styling, advanced technology, enhanced comfort, convenience and connected features; Company aligning product strategy accordingly

Cost inputs

7 verified
Direct material and imported components
Cost of inventories includes direct expenses and proportionate indirect overhead allocation; costs of purchased inventory determined after rebates and discounts
Employee benefit expenses
₹61,370 million spent on employee benefit expenses for 19,966 regular employees; 2,311 new employees joined during the year
Transportation and distribution logistics
₹44,134 million transportation and distribution expenses in FY2025; Company plans to increase rail mode dispatch share to 35% by FY2030-31 from 24.3% in FY2025
4 more statements
Warranty and product recall
₹951 million warranty and product recall expenses in FY2025; Company maintains zero-defect philosophy to minimise warranty costs
Advertisement and sales promotion
₹11,275 million advertisement and ₹6,151 million sales promotion expenses in FY2025; promotional spending increased as industry inventory rose
Tier-1 and Tier-2 supplier base
Over 400 Tier-1 and nearly 1,300 Tier-2 suppliers across regions; supply disruption is major business continuity risk; Company manages through alternate source development and localisation
Energy and manufacturing costs
Company increased usage of green power (solar and non-solar); zero use of groundwater; 63.13% of water requirement met through recycling to reduce operational costs

Geographies

3 verified
Domestic India market (85.0%)
Largest revenue source (85.01% of sales); Company operates across 36 Indian states and 8 union territories with extensive network of 4,836 sales outlets and 5,424 service outlets
Urban and non-urban expansion in India
During FY2025 Company expanded by adding 372 sales outlets and 450 service touchpoints, focusing on both urban and non-urban markets; introduced NEXA Studio format in new geographies
Global manufacturing and technology collaboration
As key subsidiary of Suzuki Motor Corporation (SMC) Japan, Company benefits from SMC's distribution network and continuous capacity enhancement; leveraging nearly 40 years of experience in Indian market
Each statement is checked word for word against the FY2025 annual report; the passages are in the app.

What changed recently?

Dividend - Rs 140 Per Share (7 Aug 2026).

Change log

8 entries · newest first
  1. Corporate actionDividend - Rs 140 Per Share.
  2. Results filedQ1 FY2027 results filed.
  3. Results filedQ4 FY2026 results filed.
  4. Results filedQ3 FY2026 results filed.
  5. Results filedQ2 FY2026 results filed.
  6. Corporate actionDividend - Rs 135 Per Share.
  7. Results filedQ1 FY2026 results filed.
  8. Results filedQ4 FY2025 results filed.
Get alerts →Sign in to be told when any of these change.

What this page does not tell you

What could not be judged, and why. Never empty.
  • Models not runFair value, EPV, Graham number, Graham value, Lynch, Owner earnings: no valuation stored.
  • FlagsCLEAN on 30 of 30 flags judged; no red flag.
  • Data gapsDividend yield, PEG (vendor), Business quality: not available yet.

What this page rests on

✓10 years of annual statements, through FY2026 (Mar-26)✓10 quarters of results✓279 months of month-end prices, adjusted for bonuses and splits○no valuation of ours yet✓business-model card FY2025 · 70 verified

Questions people ask

What is Maruti Suzuki India's share price today?

Maruti Suzuki India last traded at ₹11,315.00 on the NSE, as of 12 Oct 2026, 11:00 pm IST, down 0.9% on the day, down 30.0% over a year. Its 52-week range is ₹11,225 to ₹17,370. The live price is in the app.

What is Maruti Suzuki India's market cap?

Maruti Suzuki India's market capitalisation is about ₹3.59 lakh crore: what it would cost to buy every share at today's price. That makes it the 19th largest large cap company we cover.

Is Maruti Suzuki India Ltd a large cap, mid cap or small cap?

Maruti Suzuki India Ltd (MARUTI) is a large cap company in AMFI's classification for Jan-Jun 2026. SEBI's buckets go by rank on six-month average market capitalisation: the top 100 are large caps, 101 to 250 mid caps, the rest small caps.

What is Maruti Suzuki India Ltd's P/E ratio?

25.05, vs peers 27.5 · 4th of 7. Price divided by last year's earnings per share: how many years of today's profit you pay for.

Is Maruti Suzuki India Ltd overvalued?

Cheap, with low confidence: no valuation within 120 days; P/E 25.1 vs peers 27.5 (4th of 7); P/B 3.7 vs peers 7.2 (1st of 9).

How does Maruti Suzuki India Ltd make money?

Maruti Suzuki India Limited manufactures and sells passenger vehicles, components, and spare parts for domestic and export markets. It earns revenue primarily from vehicle sales through multiple retail channels (Arena, NEXA, Commercial, True Value) and from aftermarket parts, services, and other ancillary operations.

Who are Maruti Suzuki India Ltd's peers?

Compared with 8 Automobiles (the industry, as the basic industry was too small): Mahindra & Mahindra Ltd, Bajaj Auto Ltd, Eicher Motors Ltd, TVS Motor Company Ltd, Hyundai Motor India Ltd and 3 more. The app shows how they compare on every figure.

Is this investment advice?

No. Valarth is a research and learning tool and is not a SEBI-registered investment adviser or research analyst. The figures come from the company's filings and the exchanges; what to do with them is your call.

How did Maruti Suzuki India do last quarter?

Maruti Suzuki India reported revenue of ₹51,708 Cr, up 19.9% on a year earlier and a net profit of ₹3,447 Cr, up 1.2% in the Jun 2026 quarter.

Who owns Maruti Suzuki India?

Maruti Suzuki India is held by promoters 58.6%, foreign institutions 12.8%, domestic institutions 25.2%.

Does Maruti Suzuki India pay a dividend?

Maruti Suzuki India last paid ₹140.00 a share, ex-dividend 7 Aug 2026; nothing in the past 12 months counts toward a yield.

What do analysts say about Maruti Suzuki India?

37 analysts cover Maruti Suzuki India, and the consensus is buy. A consensus is a count of opinions, not a forecast; read it beside the numbers.

Everything on Maruti Suzuki India, and 6,621 other companies, with 212 filters and the full peer tables