VALARTH See CRISIL in the appOpen in app
CRISIL · NSE · Other Financial Services

CRISIL Ltd

What the numbers mean, from its filings and the exchange. Data as of 12 Oct 2026.
Small Cap · AMFI list Jan-Jun 2026 · Vendor sector: Financial Services
dear low confidence No valuation within 120 days; P/E 36.6 vs peers 19.2 (21st of 24); P/B 15.6 vs peers 2.4 (23rd of 25).
Statements through FY2025Prices adjusted for corporate actionsNot yet reviewed by the adversarial model

What is CRISIL's share price today?

CRISIL last traded at ₹4,479.20 on the NSE, as of 12 Oct 2026, 11:00 pm IST, up 1.2% on the day, down 3.3% over a year. Its 52-week range is ₹3,686 to ₹5,065. The live price is in the app.

₹4,479.20 +1.2% today
−3.3% over 1 year · NSE, as of 12 Oct 2026, 11:00 pm IST
60 month-end closes, 31 Oct 2021 to 30 Sep 2026, adjusted for splits and bonuses
52-week range58% of the way up
Low ₹3,686High ₹5,065

What is CRISIL's market cap?

CRISIL's market capitalisation is about ₹32,351 crore: what it would cost to buy every share at today's price. That makes it the 29th largest small cap company we cover.

₹32,351 Cr Small Cap29th largest small cap company
Small Cap means the companies ranked 251 and below by size, under SEBI's rules. Shares in issue are worked out from the market cap and the price. What market cap tells you →

Key facts

From the exchange
Symbol
NSE: CRISIL
ISIN
INE007A01025
Cap bucket
Small Cap, 29th largest by market cap
Industry (NSE)
Financial Services › Finance › Other Financial Services
Listed since
1995
Futures and options
Not traded

Is CRISIL overvalued?

Dear, with low confidence: no valuation within 120 days; P/E 36.6 vs peers 19.2 (21st of 24); P/B 15.6 vs peers 2.4 (23rd of 25).

Valuation

Latest price and trailing 12 months
P/E 36.58
vs peers 19.2 · 21st of 24
Price divided by last year's earnings per share: how many years of today's profit you pay for. Learn more →
P/B 15.60
vs peers 2.4 · 23rd of 25
Price divided by book value per share: what you pay for each rupee of net assets on the balance sheet. Learn more →
Market cap ₹32,351 Cr
Total market value of all shares, in ₹ crore. Learn more →
Dividend yield 1.4%
vs peers 1.0% · 5th of 15
Last year's dividends as a share of today's price. Learn more →
PEG (vendor) 1.71
vs peers 2.5 · 10th of 20
P/E divided by the vendor's earnings growth figure, which it does not disclose; a P/E adjusted for how fast profits grow. Learn more →
PEG on our 3-year EPS growth 3.44
P/E divided by the 3-year EPS growth rate from the stored accounts. Learn more →
3 models could be judged
Skipped — Fair value, EPV, Graham number, Graham value, Lynch, Owner earnings: no valuation stored

Our valuation range

🔒 Pro
Value range, implied growth at today's price, and the nine models behind it: in the app.

Is CRISIL a quality business?

WATCH on 10 of 22 lender flags judged.

Quality and risk

Data as of 12 Oct 2026
Business quality Not available
The kind of business, which sets the yardstick it is judged by. Learn more →
Quality score Not available
Returns, margins, leverage and consistency against its peers, out of 100. Learn more →
Risk level WATCH
10 of 22 lender flags judged
From flags on debt, earnings quality, dilution and price swings. Learn more →

Lender scorecard

Statements through FY2025 (Dec-25)
Basis: consolidated accounts, FY2026 (Mar-26) against FY2025; NSE/BSE XBRL; cost to income is operating expenses over net interest income plus other income; ROE from the market feed
Net interest margin Not available
What a lender earns on its loans and investments less what it pays for deposits and borrowings, as a share of the assets that earn interest (or of all assets where the split is not filed). Learn more →
Gross NPA Not available
Loans on which repayment has stopped, as a share of all loans, before any provision against them; from the latest results filing. Learn more →
Net NPA Not available
Bad loans after the provisions already set aside against them, as a share of loans. Learn more →
Provision coverage Not available
How much of the gross bad loans has already been provided for. Learn more →
Credit cost Not available
The year's provisions for bad loans as a share of the average loan book. Learn more →
Cost to income 71.6%
vs peers 50.6% · 21st of 24
Operating expenses (staff, branches, technology) over net interest income plus other income. Learn more →
Return on assets Not available
Profit as a share of average total assets. Learn more →
CET1 ratio Not available
Common equity tier 1 capital, the hardest kind, against risk-weighted assets; from the latest results filing. Learn more →
Loan growth YoY Not available
Growth in the loan book over the latest fiscal year. Learn more →
Deposit growth YoY Not available
Growth in deposits over the latest fiscal year. Learn more →
CASA ratio Not available
Current and savings account balances as a share of all deposits. Learn more →
Inside the app

Get a sneak peek of Valarth

Start freeStart free
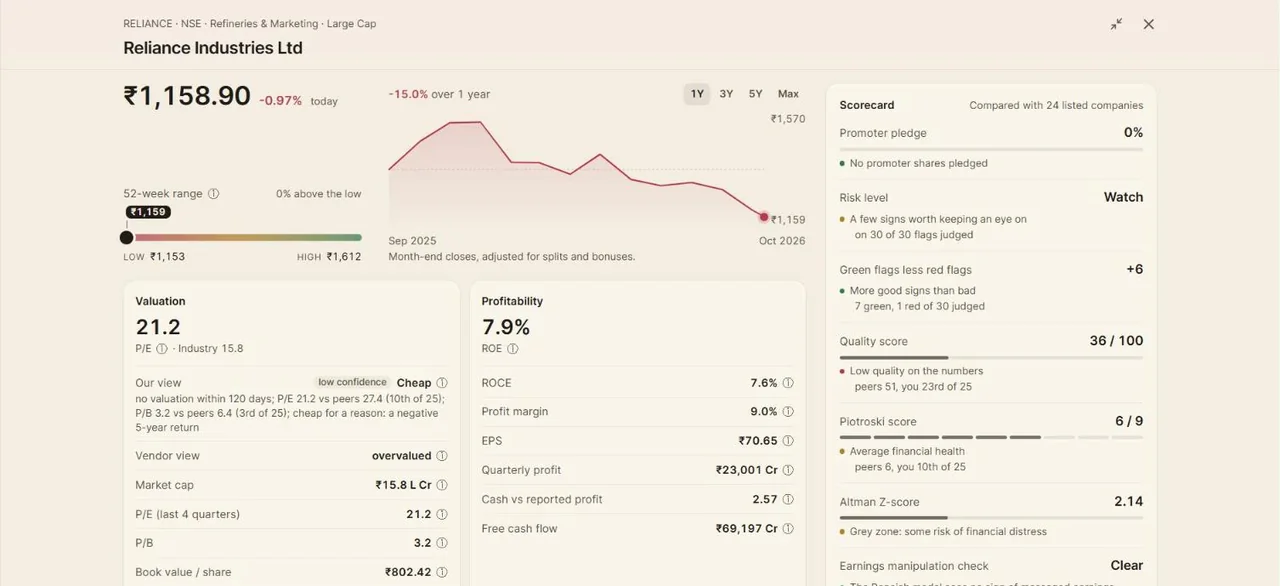
A Valarth stock page: the share price with its chart and 52-week range, valuation and profitability figures, and a scorecard of health checks.
Stock pagePrice, valuation, profitability and a scorecard of health checks for every company, each figure explained.
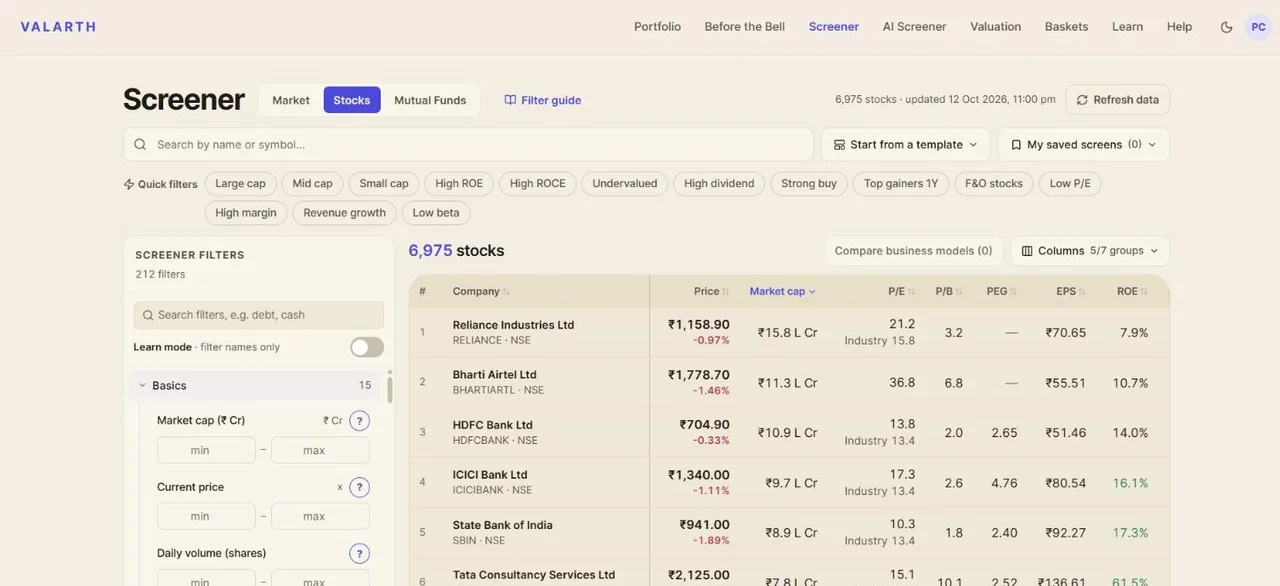
The Valarth stock screener: a table of companies with price, market cap, P/E, P/B, PEG, EPS and ROE, and filters down the left.
ScreenerEvery listed company, filtered on 212 figures, each with a plain-language lesson beside it.
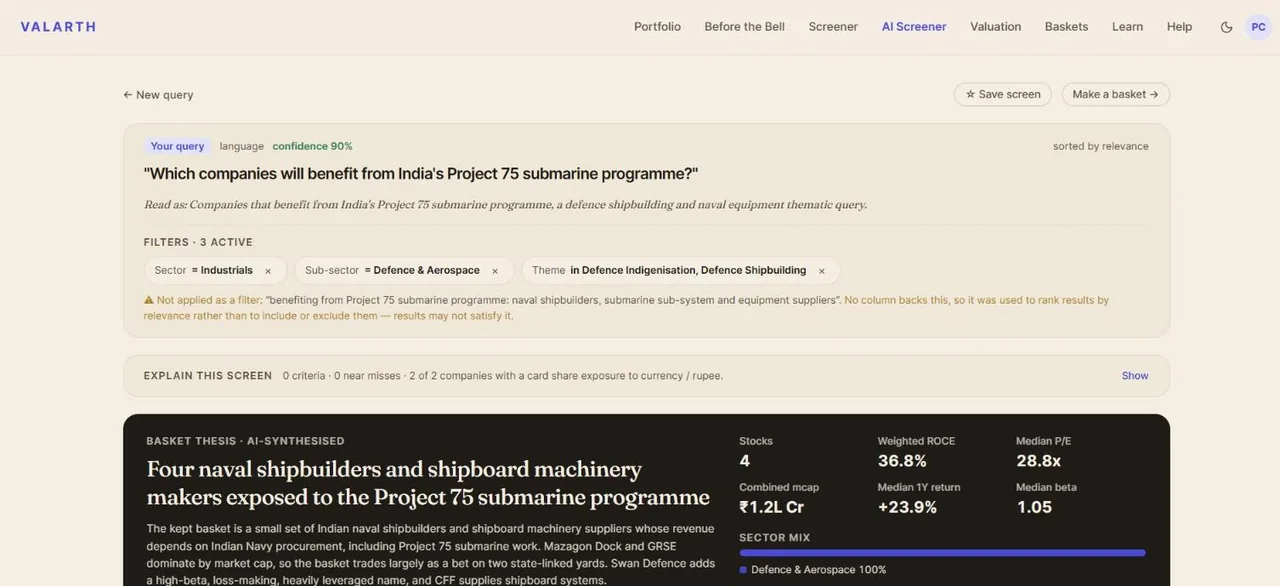
The Valarth AI Screener answering 'Which companies will benefit from India's Project 75 submarine programme?' with a basket of four naval shipbuilders and a written thesis.
AI ScreenerAsk a question in plain English, like which companies benefit from India's Project 75. It reads the intent, builds the screen and writes the thesis.
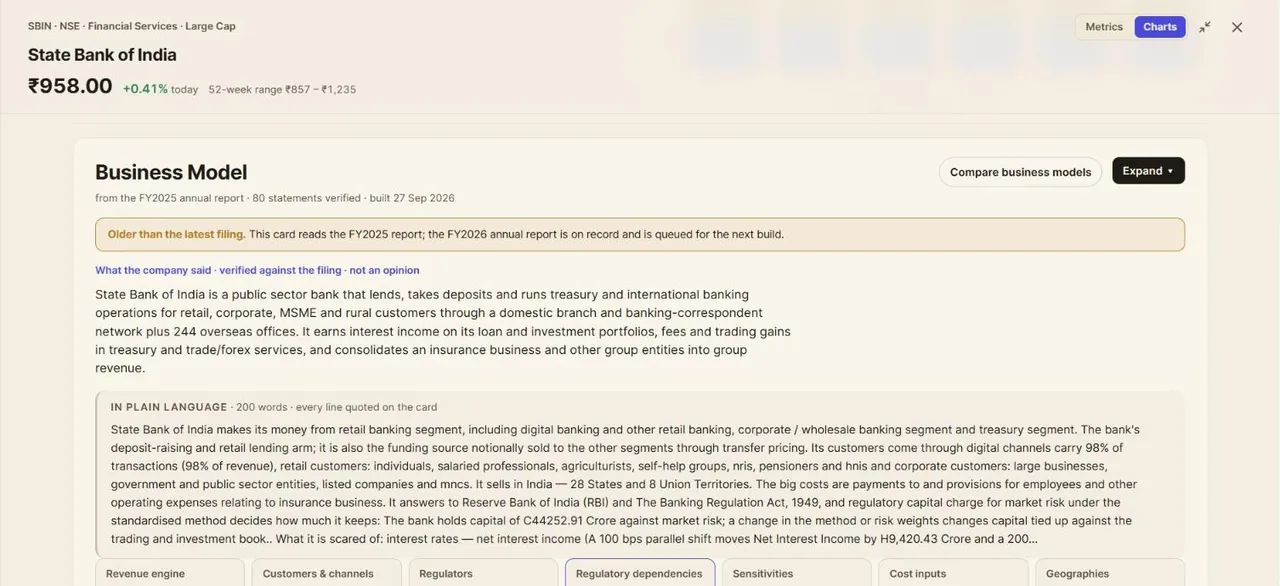
A Valarth business-model card for State Bank of India, with a plain-language summary and statements verified against the filing.
Business modelHow a company makes money and what can hurt it, each statement checked against its annual report.
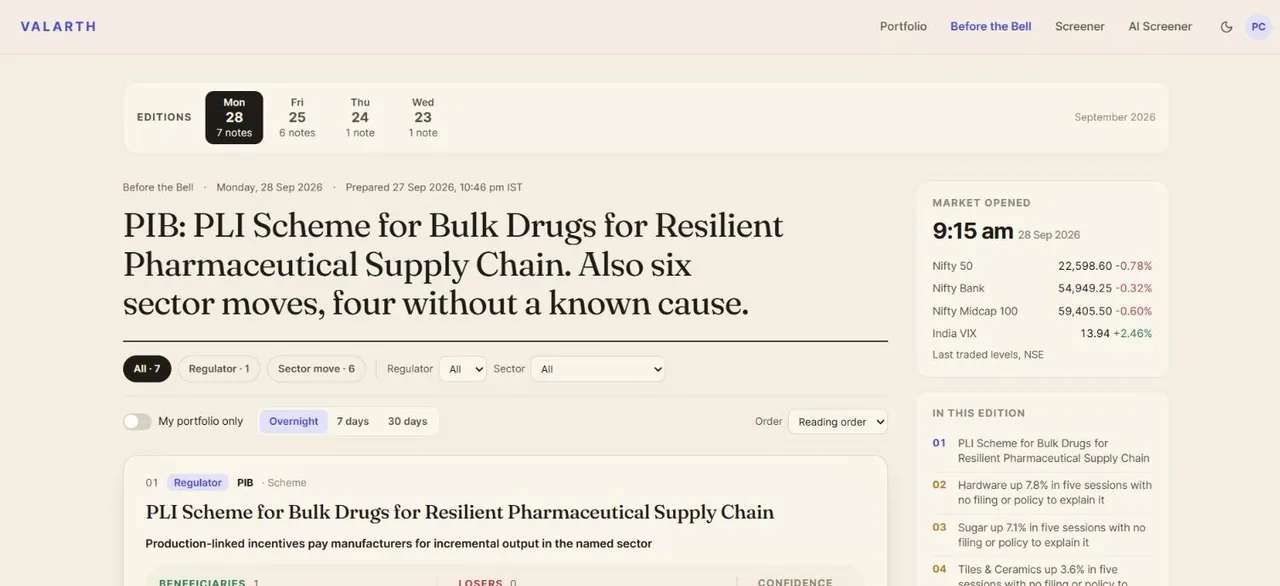
Valarth's Before the Bell edition, with the day's headline, regulator notes and sector moves.
Before the BellA morning edition before the market opens: what moved, which rule changed, and what it means for your holdings.

Has CRISIL made money for shareholders?

Mixed: −3.3% over one year and +10.4% a year over five years.

Shareholder returns

1-year return −3.3%
Price only
What the share price did over the last 12 months. Learn more →
5-year return +10.4% a year
Price only
Yearly average price return over five years, bonuses and splits adjusted. Learn more →
Wealth destroyer No
Five-year total return — price CAGR on bonus- and split-adjusted closes plus the dividend yield — below the 7% a bank fixed deposit paid. Learn more →

Returns

3Y and 5Y are yearly averages
1W
−1.8%
1M
−3.8%
3M
+8.7%
6M
+9.1%
1Y
−3.3%
3Y
+2.8%
5Y
+10.4%

Does CRISIL pay a dividend?

Yes. CRISIL's dividend yield is 1.39% at the latest price; the last payout was ₹10.00 a share, ex-dividend 27 Jul 2026.

Dividends

Per share, by ex-dividend date
Dividend yield1.39%
The past 12 months' dividends as a share of today's price.
27 Jul 2026 · Interim 2₹10.00
23 Apr 2026 · Interim 1₹9.00
2 Apr 2026 · Final₹28.00
27 Oct 2025 · Interim 3₹16.00
28 Jul 2025 · Interim 2₹9.00
Payout ratio🔒 In the app
The share of profit paid out as dividends; a very high share leaves little to reinvest.
Dividend growth, 5 years🔒 In the app
How fast the dividend per share has grown a year.
Years without a miss🔒 In the app
How many years in a row a dividend has been paid.

Is CRISIL growing?

Revenue 3 years 9.1% a year; eps 3 years 10.6% a year; revenue 5 years 11.9% a year.

Growth

Statements through FY2025 (Dec-25)
Loan growth Not available
Growth in the loan book over the latest fiscal year. Learn more →
Deposit growth Not available
Growth in deposits over the latest fiscal year. Learn more →
Revenue 3 years 9.1% a year
vs peers 19.0% · 19th of 23
Compound annual growth of revenue over three years. Learn more →
EPS 3 years 10.6% a year
Growth in earnings per share, so dilution counts against the company. Learn more →
Revenue 5 years 11.9% a year
Compound annual growth of revenue over five years. Learn more →
EPS 5 years 16.4% a year
Growth in earnings per share over five years, so dilution counts against the company. Learn more →

How did CRISIL do last quarter?

CRISIL reported income of ₹1,075 Cr, up 11.9% on a year earlier and a net profit of ₹216 Cr, up 12.0% in the Jun 2026 quarter.

Latest quarter

Jun 2026
Income, latest quarter₹1,075 Cr
+11.9% on a year earlier
What the company took in over the quarter.
Net profit, latest quarter₹216 Cr
+12.0% on a year earlier
What was left for shareholders after every cost and tax.

How does CRISIL compare with its peers?

Compared with 24 Finance (the industry, as the basic industry was too small); 21st of 24 on P/E.

Compared with 24 Finance (the industry, as the basic industry was too small)

24 companies

CRISIL against its peers

Largest 10 of 24 peers, by market cap
CompanyMarket capP/EP/BROE1YQuality 🔒Rank 🔒
CRISIL Ltd₹32,351 Cr36.615.632.3%−3.3%
Bajaj Housing Finance Ltd₹67,917 Cr25.22.712.1%−25.0%
L&T Finance Ltd₹65,467 Cr20.62.211.7%−2.0%
SBI Cards & Payment Services Ltd₹53,482 Cr23.53.814.7%−39.0%
HDB Financial Services Ltd₹48,905 Cr17.72.213.9%−20.4%
Authum Investment & Infrastructure Ltd₹46,682 Cr22.22.513.2%−13.6%
Piramal Finance Ltd₹46,645 Cr26.41.55.5%+49.0%
Sundaram Finance Ltd₹45,704 Cr20.43.815.4%−7.1%
Mahindra & Mahindra Financial Services Ltd₹44,410 Cr13.71.612.5%+12.4%
Poonawalla Fincorp Ltd₹39,389 Cr34.92.95.9%−15.3%
Housing & Urban Development Corporation Ltd₹31,980 Cr7.51.620.2%−30.7%
Peer median—19.22.413.0%−13.2%
Market cap in rupees crore; P/E and P/B on the latest price; 1Y is the price return over a year. A dash is a figure that does not apply or is not reported.

Full peer comparison

🔒 Pro
Every peer, every figure, the ranks and the quality and forensic scores side by side: in the app.

Who owns CRISIL?

CRISIL is held by promoters 66.6%, foreign institutions 6.4%, domestic institutions 12.9%.

Shareholding pattern

Latest filing, percent of shares
Promoters66.6%
The founders and controlling group.
Foreign institutions6.4%
Overseas funds investing through the FPI route.
Domestic institutions12.9%
Indian insurers, banks, pension and mutual funds together.
Mutual funds7.2%
Indian mutual fund schemes; part of domestic institutions.
Retail and others7.5%
Individual investors and everyone else.
Promoter shares pledged🔒 In the app
Promoter shares given as collateral for loans; a high share is a risk to watch.
Holding trend🔒 In the app
Whether promoters, foreign funds and mutual funds have been adding or selling over recent quarters.

What do analysts say about CRISIL?

1 analyst cover CRISIL, and the consensus is buy. A consensus is a count of opinions, not a forecast; read it beside the numbers.

Analyst consensus

1 analysts
ConsensusBuy
The rating most covering analysts give the share.
Average target price🔒 In the app
The mean of the analysts' 12-month price targets.
Upside to target🔒 In the app
How far the target sits above or below today's price.
Share rating it a buy🔒 In the app
The share of covering analysts with a buy rating.

What does CRISIL do and what is it sensitive to?

The filing describes a business that sells credit ratings and research, analytics and solutions to clients including banks, companies, investors and policy makers across 40 countries including India. Sensitive to: rupee exchange rate against major currencies.

Business-model card

FY2025 · 31 verified
2Revenue
4Channels
1Regulators
2Reg. dependencies
2Sensitivities
2Costs
3Geographies

The filing describes a business that sells credit ratings and research, analytics and solutions to clients including banks, companies, investors and policy makers across 40 countries including India. Interpretation: revenue comes from fees under client agreements, with research billed at rates specified in those agreements and ratings sold as rating services; ratings are 30% and research, analytics and solutions 70% of turnover.

Revenue by segment

year ended December 31, 2025 (consolidated segment note; amounts in ₹ Lakh)
Ratings services29.5%
Research, Analytics and Solutions70.5%

Revenue engine

2 verified
Research, analytics and solutions (70.0%)
Research revenue is billed on contract terms. Time-and-material research is recognised on output measured by hours, days or weeks worked at the rates in the agreements. Interpretation: revenue scales with billable effort and contract rates.
Ratings (30.0%)
Ratings revenue comes from credit rating services covering bond ratings, bank loan ratings and services pertaining to the Global Analytics Centre. Interpretation: the filing does not state the pricing basis for ratings.

Customers & channels

4 verified
Micro, small, medium and large corporates, investors and global financial institutions
The client base spans company sizes and investor types, so demand is spread across several client groups.
Commercial and investment banks, insurers, private equity and asset managers
These financial-sector clients buy ratings and analytics. Interpretation: exposure to financial-sector spending cycles.
Financial institutions and investors reached through ratings business
The filing says the ratings business engages these groups to create awareness on rating trends.
1 more statement
Policy makers in the infrastructure space
Policy-maker work is stated for India and other emerging markets, a separate client group from banks and investors.

Regulators

1 verified
SEBI (Credit Rating Agencies) Regulations, 1999
Governs the ratings business as a credit rating agency; the filing lists it among laws specifically applicable to the company.

Regulatory dependencies

2 verified
Regulatory sanctions and financial penalties for non-compliance
Interpretation: a stricter or more complex rule regime across financial markets, data protection, ESG and taxation could raise compliance cost and create penalties that reduce profit.
Exposure to complex and evolving regulatory frameworks across jurisdictions
Interpretation: the company operates in multiple jurisdictions, so changes in financial-market, data protection, ESG, tax or governance rules in any of them would require policy and control updates.

Sensitivities

2 verified
Rupee exchange rate against major currencies
Interpretation: with significant foreign currency revenue, a rupee appreciation lowers the rupee value of that revenue and a depreciation raises it; the filing says the effect is material to profit in either direction and that forward contracts are used over a 12-month horizon.
Client pricing pressure and budget constraints
When clients face budget constraints or competitors price down, growth and margins may fall, per the filing.

Cost inputs

2 verified
Software purchase and maintenance expenses
A separate operating expense line for software purchase and upkeep; the filing does not name suppliers.
Overhead recovered from subsidiaries
Recoveries from subsidiaries towards overhead allocated offset the expense line. Interpretation: the parent bears group overhead partly recharged to subsidiaries.

Geographies

3 verified
Export share of turnover (69.0%)
Exports are a majority of turnover, so foreign-currency earnings drive the FX exposure described elsewhere.
40 countries including India
Stated count of locations served, including India.
International offices in 13 countries excluding India
Offices outside India, a presence distinct from the national network of 11 offices in 7 states.
Each statement is checked word for word against the FY2025 annual report; the passages are in the app.

What changed recently?

Q1 FY2027 results filed (21 Jul 2026).

Change log

6 entries · newest first
  1. Results filedQ1 FY2027 results filed.
  2. Results filedQ4 FY2026 results filed.
  3. Results filedQ3 FY2026 results filed.
  4. Results filedQ2 FY2026 results filed.
  5. Results filedQ1 FY2026 results filed.
  6. Results filedQ4 FY2025 results filed.
Get alerts →Sign in to be told when any of these change.

What this page does not tell you

What could not be judged, and why. Never empty.
  • Models not runFair value, EPV, Graham number, Graham value, Lynch, Owner earnings: no valuation stored.
  • FlagsWATCH on 10 of 22 lender flags judged; 1 red; 12 could not be judged.
  • Data gapsBusiness quality, Quality score, Net interest margin, Gross NPA, Net NPA, Provision coverage and 8 more: not available yet.
Not applicable to a bank, lender or insurer · 12
  • Altman ZAltman Z reads working capital and sales over assets, which a lender's balance sheet does not have.
  • Piotroski F-scorePiotroski's leverage and liquidity checks read deposits and borrowings as weakness.
  • Beneish M-scoreThe Beneish model reads receivables, margins and depreciation that a lender's accounts do not report.
  • Operating marginInterest is a lender's cost of goods, so operating profit before interest is not defined.
  • Interest coverageInterest is a lender's main cost, not a charge on operating profit.
  • Debt to equityBorrowings and deposits are a lender's raw material; gearing is judged by capital adequacy instead.
  • EV/EBITDAEnterprise value adds borrowings to market cap; for a lender borrowings are the business, not a claim on it.
  • FCF yieldOperating cash flow less capex is not free cash flow for a lender: loan growth sits in operating cash flow.
  • Cash conversion cycleA lender's receivables are its loan book, not invoices waiting to be paid.
  • Asset turnoverA lender earns a spread on its assets, not a turnover of them.
  • ROCEEBIT over capital employed reads a lender's interest income against its borrowings; return on assets and return on equity are the lender's measures.
  • ROCE, 10-year averageEBIT over capital employed reads a lender's interest income against its borrowings; return on assets is the lender's measure (HDFC Bank's 1.7% ten-year ROCE means nothing).

What this page rests on

✓10 years of annual statements, through FY2025 (Dec-25)✓10 quarters of results✓285 months of month-end prices, adjusted for bonuses and splits○no valuation of ours yet✓business-model card FY2025 · 31 verified

Questions people ask

What is CRISIL's share price today?

CRISIL last traded at ₹4,479.20 on the NSE, as of 12 Oct 2026, 11:00 pm IST, up 1.2% on the day, down 3.3% over a year. Its 52-week range is ₹3,686 to ₹5,065. The live price is in the app.

What is CRISIL's market cap?

CRISIL's market capitalisation is about ₹32,351 crore: what it would cost to buy every share at today's price. That makes it the 29th largest small cap company we cover.

Is CRISIL Ltd a large cap, mid cap or small cap?

CRISIL Ltd (CRISIL) is a small cap company in AMFI's classification for Jan-Jun 2026. SEBI's buckets go by rank on six-month average market capitalisation: the top 100 are large caps, 101 to 250 mid caps, the rest small caps.

What is CRISIL Ltd's P/E ratio?

36.58, vs peers 19.2 · 21st of 24. Price divided by last year's earnings per share: how many years of today's profit you pay for.

Is CRISIL Ltd overvalued?

Dear, with low confidence: no valuation within 120 days; P/E 36.6 vs peers 19.2 (21st of 24); P/B 15.6 vs peers 2.4 (23rd of 25).

How does CRISIL Ltd make money?

The filing describes a business that sells credit ratings and research, analytics and solutions to clients including banks, companies, investors and policy makers across 40 countries including India. Interpretation: revenue comes from fees under client agreements, with research billed at rates specified in those agreements and ratings sold as rating services; ratings are 30% and research, analytics and solutions 70% of turnover.

Why is there no Altman Z or debt to equity for CRISIL?

Borrowing is a bank's or lender's raw material, so those ratios mislead. Net interest margin, gross NPA, return on assets and the capital ratios are shown instead.

Who are CRISIL Ltd's peers?

Compared with 24 Finance (the industry, as the basic industry was too small): Bajaj Housing Finance Ltd, L&T Finance Ltd, SBI Cards & Payment Services Ltd, HDB Financial Services Ltd, Authum Investment & Infrastructure Ltd and 19 more. The app shows how they compare on every figure.

Is this investment advice?

No. Valarth is a research and learning tool and is not a SEBI-registered investment adviser or research analyst. The figures come from the company's filings and the exchanges; what to do with them is your call.

How did CRISIL do last quarter?

CRISIL reported income of ₹1,075 Cr, up 11.9% on a year earlier and a net profit of ₹216 Cr, up 12.0% in the Jun 2026 quarter.

Who owns CRISIL?

CRISIL is held by promoters 66.6%, foreign institutions 6.4%, domestic institutions 12.9%.

Does CRISIL pay a dividend?

Yes. CRISIL's dividend yield is 1.39% at the latest price; the last payout was ₹10.00 a share, ex-dividend 27 Jul 2026.

What do analysts say about CRISIL?

1 analyst cover CRISIL, and the consensus is buy. A consensus is a count of opinions, not a forecast; read it beside the numbers.

Everything on CRISIL, and 6,621 other companies, with 212 filters and the full peer tables