VALARTH See Force Motors in the appOpen in app
FORCEMOT · NSE · Passenger Cars & Utility Vehicles

Force Motors Ltd

What the numbers mean, from its filings and the exchange. Data as of 13 Oct 2026.
Small Cap · AMFI list Jan-Jun 2026 · Vendor sector: Consumer Cyclical
cheap low confidence No valuation within 120 days; P/E 17.8 vs peers 33.5 (1st of 6); P/B 6.0 vs peers 7.0 (4th of 9).
Statements through FY2026Prices adjusted for corporate actionsNot yet reviewed by the adversarial model

What is Force Motors's share price today?

Force Motors last traded at ₹17,033.00 on the NSE, as of 13 Oct 2026, 1:00 pm IST, up 0.1% on the day, up 5.4% over a year. Its 52-week range is ₹14,911 to ₹26,450. The live price is in the app.

₹17,033.00 +0.1% today
+5.4% over 1 year · NSE, as of 13 Oct 2026, 1:00 pm IST
60 month-end closes, 30 Jun 2021 to 30 Sep 2026, adjusted for splits and bonuses
52-week range18% of the way up
Low ₹14,911High ₹26,450

What is Force Motors's market cap?

Force Motors's market capitalisation is about ₹22,413 crore: what it would cost to buy every share at today's price. That makes it the 96th largest small cap company we cover.

₹22,413 Cr Small Cap96th largest small cap company
Small Cap means the companies ranked 251 and below by size, under SEBI's rules. Shares in issue are worked out from the market cap and the price. What market cap tells you →

Key facts

From the exchange
Symbol
NSE: FORCEMOT
ISIN
INE451A01017
Cap bucket
Small Cap, 96th largest by market cap
Industry (NSE)
Consumer Discretionary › Automobile and Auto Components › Automobiles › Passenger Cars & Utility Vehicles
Listed since
2024
Futures and options
Traded

Is Force Motors overvalued?

Cheap, with low confidence: no valuation within 120 days; P/E 17.8 vs peers 33.5 (1st of 6); P/B 6.0 vs peers 7.0 (4th of 9).

Valuation

Latest price and trailing 12 months
P/E 17.79
vs peers 33.5 · 1st of 6
Price divided by last year's earnings per share: how many years of today's profit you pay for. Learn more →
P/B 6.00
vs peers 7.0 · 4th of 9
Price divided by book value per share: what you pay for each rupee of net assets on the balance sheet. Learn more →
Market cap ₹22,413 Cr
Total market value of all shares, in ₹ crore. Learn more →
Dividend yield 0.3%
vs peers 1.2% · 6th of 6
Last year's dividends as a share of today's price. Learn more →
PEG (vendor) 0.06
vs peers 2.4 · 1st of 6
P/E divided by the vendor's earnings growth figure, which it does not disclose; a P/E adjusted for how fast profits grow. Learn more →
PEG on our 3-year EPS growth 0.16
P/E divided by the 3-year EPS growth rate from the stored accounts. Learn more →
3 models could be judged
Skipped — Fair value, EPV, Graham number, Graham value, Lynch, Owner earnings: no valuation stored

Our valuation range

🔒 Pro
Value range, implied growth at today's price, and the nine models behind it: in the app.

Is Force Motors a quality business?

Quality score 72.9, 1st of 9 in its peer set; WATCH on 30 of 30 flags judged.

Quality and risk

Data as of 13 Oct 2026
Business quality Not available
The kind of business, which sets the yardstick it is judged by. Learn more →
Quality score 72.9
vs peers 44.0 · 1st of 9
Returns, margins, leverage and consistency against its peers, out of 100. Learn more →
Risk level WATCH
30 of 30 flags judged
From flags on debt, earnings quality, dilution and price swings. Learn more →

Profitability

ROE 25.6%
vs peers 27.9% · 4th of 7
Return on equity: profit as a share of shareholders' money. Learn more →
ROCE 34.8%
vs peers 31.8% · 3rd of 7
Return on capital employed: operating profit as a share of all the capital in the business, debt and equity. Learn more →
Profit margin 13.1%
vs peers 6.9% · 3rd of 8
Profit after everything, as a share of revenue. Learn more →
EPS ₹919.39
Trailing 12 months
Profit for each share over the last 12 months.

Scorecard

🔒 Pro
Health scores and red flags with their values and history: in the app.
Inside the app

Get a sneak peek of Valarth

Start freeStart free
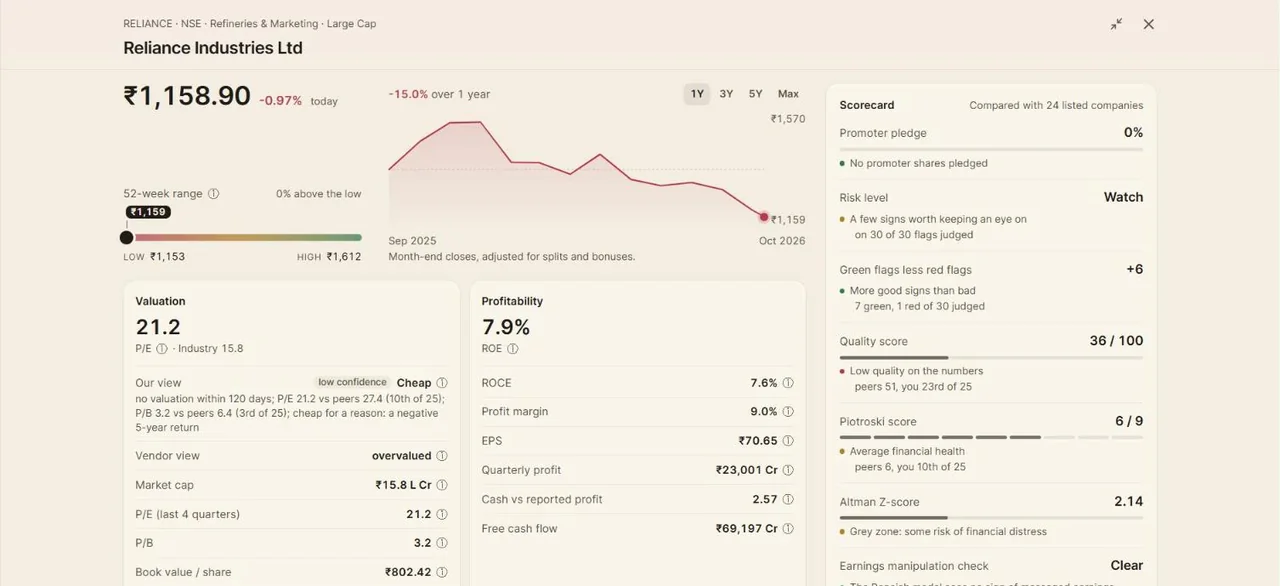
A Valarth stock page: the share price with its chart and 52-week range, valuation and profitability figures, and a scorecard of health checks.
Stock pagePrice, valuation, profitability and a scorecard of health checks for every company, each figure explained.
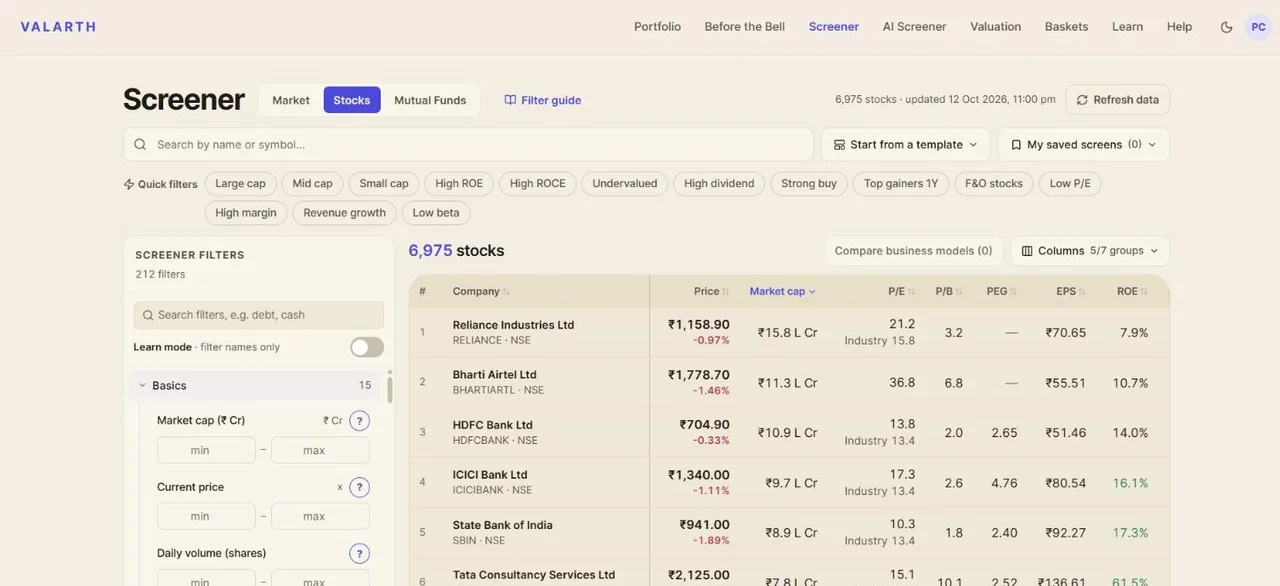
The Valarth stock screener: a table of companies with price, market cap, P/E, P/B, PEG, EPS and ROE, and filters down the left.
ScreenerEvery listed company, filtered on 212 figures, each with a plain-language lesson beside it.
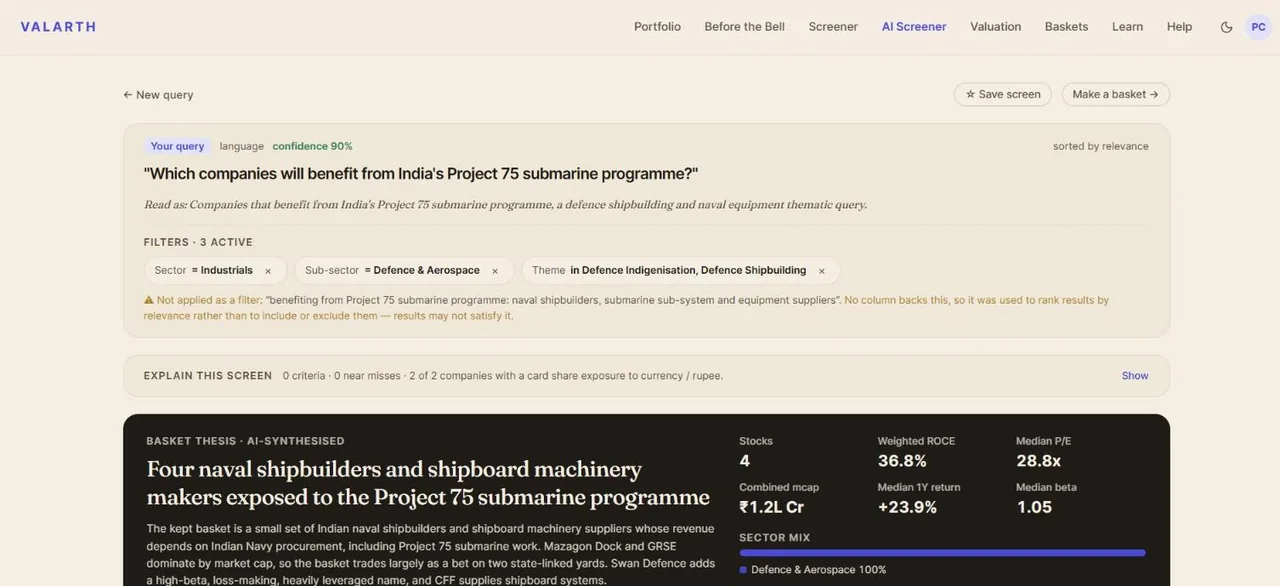
The Valarth AI Screener answering 'Which companies will benefit from India's Project 75 submarine programme?' with a basket of four naval shipbuilders and a written thesis.
AI ScreenerAsk a question in plain English, like which companies benefit from India's Project 75. It reads the intent, builds the screen and writes the thesis.
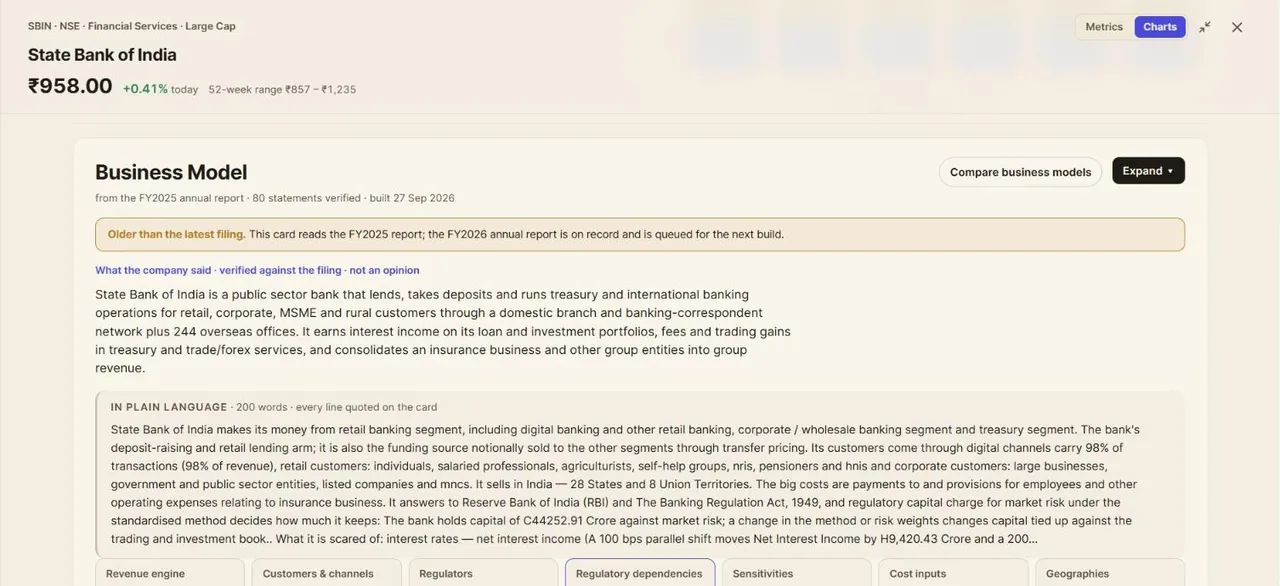
A Valarth business-model card for State Bank of India, with a plain-language summary and statements verified against the filing.
Business modelHow a company makes money and what can hurt it, each statement checked against its annual report.
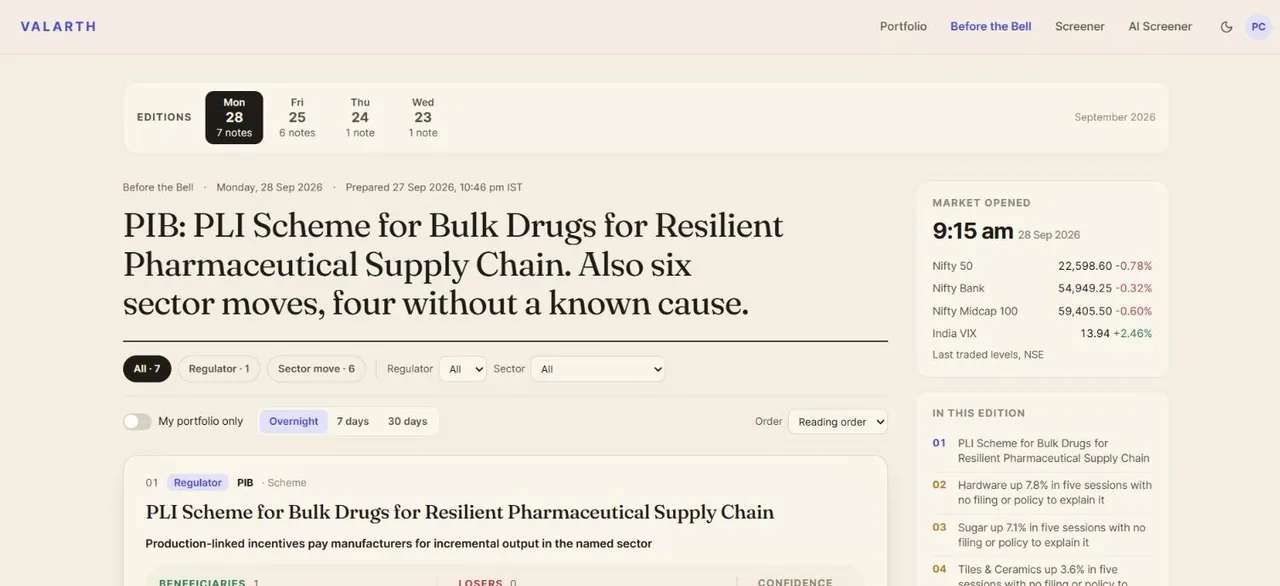
Valarth's Before the Bell edition, with the day's headline, regulator notes and sector moves.
Before the BellA morning edition before the market opens: what moved, which rule changed, and what it means for your holdings.

Has Force Motors made money for shareholders?

Yes: +5.4% over one year and +63.3% a year over five years.

Shareholder returns

1-year return +5.4%
Price only
What the share price did over the last 12 months. Learn more →
5-year return +63.3% a year
Price only
Yearly average price return over five years, bonuses and splits adjusted. Learn more →
Wealth destroyer No
Five-year total return — price CAGR on bonus- and split-adjusted closes plus the dividend yield — below the 7% a bank fixed deposit paid. Learn more →

Returns

3Y and 5Y are yearly averages
1W
−0.6%
1M
−1.4%
3M
−5.3%
6M
−22.9%
1Y
+5.4%
3Y
—
5Y
+63.3%
— not available

Does Force Motors pay a dividend?

Yes. Force Motors's dividend yield is 0.26% at the latest price; the last payout was ₹50.00 a share, ex-dividend 9 Sep 2026.

Dividends

Per share, by ex-dividend date
Dividend yield0.26%
The past 12 months' dividends as a share of today's price.
9 Sep 2026 · Final₹50.00
10 Sep 2025 · Final₹40.00
28 Aug 2024 · Final₹20.00
21 Sep 2023 · Final₹10.00
20 Sep 2022 · Final₹10.00
Payout ratio🔒 In the app
The share of profit paid out as dividends; a very high share leaves little to reinvest.
Dividend growth, 5 years🔒 In the app
How fast the dividend per share has grown a year.
Years without a miss🔒 In the app
How many years in a row a dividend has been paid.

Is Force Motors growing?

Revenue 3 years 20.5% a year; profit 3 years 108.5% a year; revenue 5 years 23.7% a year.

Growth

Statements through FY2026 (Mar-26)
Revenue 3 years 20.5% a year
vs peers 15.4% · 3rd of 9
Compound annual growth of revenue over three years. Learn more →
Profit 3 years 108.5% a year
vs peers 29.2% · 2nd of 7
Compound annual growth of net profit over three years. Learn more →
Revenue 5 years 23.7% a year
Compound annual growth of revenue over five years. Learn more →
Profit 5 years Not available
Compound annual growth of net profit over five years. Learn more →
EPS 3 years 108.5% a year
Growth in earnings per share, so dilution counts against the company. Learn more →
EPS 5 years Not available
Growth in earnings per share over five years, so dilution counts against the company. Learn more →
P/E vs own history -27.1%
vs peers -23.5% · 3rd of 6
Today's P/E against its own 5-year median; negative is cheaper than its history. Learn more →

How did Force Motors do last quarter?

Force Motors reported revenue of ₹2,440 Cr, up 12.2% on a year earlier and a net profit of ₹217 Cr, up 51.3% in the Jun 2026 quarter.

Latest quarter

Jun 2026
Revenue, latest quarter₹2,440 Cr
+12.2% on a year earlier
What the company took in over the quarter.
Net profit, latest quarter₹217 Cr
+51.3% on a year earlier
What was left for shareholders after every cost and tax.

How does Force Motors compare with its peers?

Compared with 8 Automobiles (the industry, as the basic industry was too small); 1st of 6 on P/E; 1st of 9 on quality score.

Compared with 8 Automobiles (the industry, as the basic industry was too small)

8 companies

Force Motors against its peers

Largest 8 of 8 peers, by market cap
CompanyMarket capP/EP/BROEROCE1YQuality 🔒Rank 🔒
Force Motors Ltd₹22,413 Cr17.86.025.6%34.8%+5.4%
Eicher Motors Ltd₹2.0 L Cr33.58.325.0%31.2%+3.0%
TVS Motor Company Ltd₹1.9 L Cr53.614.234.2%37.1%+12.5%
Hyundai Motor India Ltd₹1.6 L Cr31.87.530.3%35.1%−18.6%
Tata Motors Passenger Vehicles Ltd₹1.0 L Cr—4.4302.8%15.1%−28.9%
Hero MotoCorp Ltd₹98,810 Cr18.04.725.5%32.4%−11.2%
Ather Energy Ltd₹59,944 Cr—11.2——+147.1%
Ola Electric Mobility Ltd₹16,514 Cr—0.9——−30.3%
Olectra Greentech Ltd₹8,598 Cr48.46.515.2%20.2%−29.1%
Peer median—33.57.027.9%31.8%−15.3%
Market cap in rupees crore; P/E and P/B on the latest price; 1Y is the price return over a year. A dash is a figure that does not apply or is not reported.

Full peer comparison

🔒 Pro
Every peer, every figure, the ranks and the quality and forensic scores side by side: in the app.

Who owns Force Motors?

Force Motors is held by promoters 61.6%, foreign institutions 9.5%, domestic institutions 1.5%.

Shareholding pattern

Latest filing, percent of shares
Promoters61.6%
The founders and controlling group.
Foreign institutions9.5%
Overseas funds investing through the FPI route.
Domestic institutions1.5%
Indian insurers, banks, pension and mutual funds together.
Mutual funds0.8%
Indian mutual fund schemes; part of domestic institutions.
Retail and others20.5%
Individual investors and everyone else.
Promoter shares pledged🔒 In the app
Promoter shares given as collateral for loans; a high share is a risk to watch.
Holding trend🔒 In the app
Whether promoters, foreign funds and mutual funds have been adding or selling over recent quarters.

What does Force Motors do and what is it sensitive to?

Force Motors Limited makes commercial vehicles, motor vehicle engines and automotive parts and aggregates, and sells them through dealers and distributors to government agencies, public transport, education, health, defence and logistics customers. Sensitive to: foreign exchange rates.

Business-model card

FY2025 · 43 verified
3Revenue
4Channels
4Regulators
5Reg. dependencies
5Sensitivities
4Costs
3Geographies

Force Motors Limited makes commercial vehicles, motor vehicle engines and automotive parts and aggregates, and sells them through dealers and distributors to government agencies, public transport, education, health, defence and logistics customers. It earns mainly from vehicle and engine sales, with exports at 1.98% of turnover in FY2025.

Revenue engine

3 verified
Commercial Vehicles (55.4%)
Vehicle sales, the largest product line by share of turnover. Interpretation: revenue is booked on sale to dealers and customers, net of GST, returns, discounts and rebates per the revenue policy.
Motor Vehicle Engines (32.4%)
Engine sales, the second product line by share of turnover (BS 6.2 diesel and related drivelines are named elsewhere in the filing).
Diverse parts and accessories for motor vehicles (6.6%)
Parts and accessories sold for motor vehicles, listed as the third product line by share of turnover.

Customers & channels

4 verified
Dealers and distributors (55.0%)
Largest sales channel by share of total sales. Interpretation: dealer and distributor sales dominate the revenue channel, and the top-10 dealer share of dealer sales was 21.55%.
Dealer network size
Number of dealers and distributors that received sales in the year (640 in 2024-25 vs 604 in 2023-24).
Institutional and public-sector customers
Customer base named by the company: government agencies, public transport, educational institutes, health services, defence and logistics.
1 more statement
Dealership and service network
Company describes its sales and service reach through dealerships and service centres in India.

Regulators

4 verified
Government of India
Sets the policy push on fuels and vehicle electrification (organic fuels and EV promotion) that shapes which drivelines the company must develop.
Tax authorities (vehicle taxation)
Set the tax levels on vans, which the company says are adverse for vans of 10 to 13 seats; this governs the price and demand of its van products.
State governments (laws under state jurisdiction)
Govern land and other laws the company says need simplification for new facilities and products.
1 more statement
Department of Scientific and Industrial Research (DSIR)
Government approvals that the auditor checked before product development costs were capitalised. Interpretation: DSIR approval affects the timing of R&D expense recognition.

Regulatory dependencies

5 verified
High taxation on vans
Tax on vans is named as a challenge to be addressed. Interpretation: a lower van tax would lower vehicle prices and could lift van volumes; a higher tax would do the reverse.
Vehicle tax on 10 to 13 seat vans
The company describes van tax levels for 10 to 13 seat vans as extremely adverse. Interpretation: a change in this tax band would move pricing and demand for these vehicles.
Inner-city restrictions on diesel vehicles
Restrictions in inner cities apply even though diesel vehicles meet mandated emission rules. Interpretation: restrictions reduce diesel passenger and mass-transport van demand, which the company says damages sales and image.
2 more statements
Data privacy regulations
Non-compliance with data privacy rules can bring fines, which is a cost line. Interpretation: stricter rules raise compliance and fine exposure as digital systems grow.
Capitalisation of product development cost
Costs are capitalised only where Ind AS 38 criteria are met and approvals exist. Interpretation: a tighter test would move R&D cost from the balance sheet into the income statement.

Sensitivities

5 verified
Foreign exchange rates
Net foreign currency exposure is covered by a natural hedge, per the company. Interpretation: the profit effect of a 5% move in USD or EUR is small, shown in the sensitivity table.
Interest rates
Borrowings are at fixed rates, but changes linked to Repo, MCLR and SOFR rates still apply. Interpretation: a rise in these benchmarks raises the cost of floating-linked debt.
Finance costs and working capital
The company says tight working capital management led to a significant drop in finance costs towards year-end. Interpretation: higher working capital or borrowing cost would reduce profit.
2 more statements
Steel and metal prices
Commodity risk is managed through budgeted consumption and procurement strategy. Interpretation: a rise in steel and metal prices raises the cost of finished vehicles.
Rare earth and critical mineral supply
Interpretation: with no viable substitutes, a supply disruption or rising demand raises procurement cost or halts production.

Cost inputs

4 verified
Raw materials, components and others from related party Pinnacle Industries Ltd.
Largest related-party purchase line in the notes. The amount is shown in the table without a unit stated in the excerpt (33,472 in 2024-25 vs 28,728 in 2023-24).
Purchases from trading houses (0.6%)
Share of total purchases bought from trading houses; the top 10 trading houses account for 33.69% of those purchases.
Steel and other metals
Main commodity input named in the market risk section; procurement follows budgeted consumption and price trend review.
1 more statement
Rare earth and critical minerals
Named as a significant raw material with no viable substitutes; supply shortage raises procurement cost or halts production.

Geographies

3 verified
India (domestic market)
Domestic market served across states and union territories; the company's main market given that exports are 1.98% of turnover.
Export markets (2.0%)
Exports reach more than 25 countries across Asia, the Middle East, Latin America and Africa, supported by the company's manufacturing plants.
International market expansion through partners
Company builds dealer and service networks in key international markets with trusted partners.
Each statement is checked word for word against the FY2025 annual report; the passages are in the app.

What changed recently?

Dividend - Rs 50 Per Share (9 Sep 2026).

Change log

8 entries · newest first
  1. Corporate actionDividend - Rs 50 Per Share.
  2. Results filedQ1 FY2027 results filed.
  3. Results filedQ4 FY2026 results filed.
  4. Results filedQ3 FY2026 results filed.
  5. Results filedQ2 FY2026 results filed.
  6. Corporate actionDividend - Rs 40 Per Share.
  7. Results filedQ1 FY2026 results filed.
  8. Results filedQ4 FY2025 results filed.
Get alerts →Sign in to be told when any of these change.

What this page does not tell you

What could not be judged, and why. Never empty.
  • Models not runFair value, EPV, Graham number, Graham value, Lynch, Owner earnings: no valuation stored.
  • FlagsWATCH on 30 of 30 flags judged; 1 red.
  • Data gapsBusiness quality, Profit 5 years, EPS 5 years: not available yet.

What this page rests on

✓10 years of annual statements, through FY2026 (Mar-26)✓10 quarters of results✓82 months of month-end prices, adjusted for bonuses and splits○no valuation of ours yet✓business-model card FY2025 · 43 verified

Questions people ask

What is Force Motors's share price today?

Force Motors last traded at ₹17,033.00 on the NSE, as of 13 Oct 2026, 1:00 pm IST, up 0.1% on the day, up 5.4% over a year. Its 52-week range is ₹14,911 to ₹26,450. The live price is in the app.

What is Force Motors's market cap?

Force Motors's market capitalisation is about ₹22,413 crore: what it would cost to buy every share at today's price. That makes it the 96th largest small cap company we cover.

Is Force Motors Ltd a large cap, mid cap or small cap?

Force Motors Ltd (FORCEMOT) is a small cap company in AMFI's classification for Jan-Jun 2026. SEBI's buckets go by rank on six-month average market capitalisation: the top 100 are large caps, 101 to 250 mid caps, the rest small caps.

What is Force Motors Ltd's P/E ratio?

17.79, vs peers 33.5 · 1st of 6. Price divided by last year's earnings per share: how many years of today's profit you pay for.

Is Force Motors Ltd overvalued?

Cheap, with low confidence: no valuation within 120 days; P/E 17.8 vs peers 33.5 (1st of 6); P/B 6.0 vs peers 7.0 (4th of 9).

How does Force Motors Ltd make money?

Force Motors Limited makes commercial vehicles, motor vehicle engines and automotive parts and aggregates, and sells them through dealers and distributors to government agencies, public transport, education, health, defence and logistics customers. It earns mainly from vehicle and engine sales, with exports at 1.98% of turnover in FY2025.

Who are Force Motors Ltd's peers?

Compared with 8 Automobiles (the industry, as the basic industry was too small): Eicher Motors Ltd, TVS Motor Company Ltd, Hyundai Motor India Ltd, Tata Motors Passenger Vehicles Ltd, Hero MotoCorp Ltd and 3 more. The app shows how they compare on every figure.

Is this investment advice?

No. Valarth is a research and learning tool and is not a SEBI-registered investment adviser or research analyst. The figures come from the company's filings and the exchanges; what to do with them is your call.

How did Force Motors do last quarter?

Force Motors reported revenue of ₹2,440 Cr, up 12.2% on a year earlier and a net profit of ₹217 Cr, up 51.3% in the Jun 2026 quarter.

Who owns Force Motors?

Force Motors is held by promoters 61.6%, foreign institutions 9.5%, domestic institutions 1.5%.

Does Force Motors pay a dividend?

Yes. Force Motors's dividend yield is 0.26% at the latest price; the last payout was ₹50.00 a share, ex-dividend 9 Sep 2026.

More small cap companies

Everything on Force Motors, and 6,621 other companies, with 212 filters and the full peer tables